

Do you know why some visitors engage deeply with every page on your website while others barely make it past the homepage? For marketers, understanding these patterns is key. It’s about creating an engaging site experience — a user-centered journey that drives organic growth.
Behavioral analytics provides a clear view of how users interact with your site: where they click, what grabs their attention and what makes them leave. These aren’t just numbers; they’re signals that point to where to refine content, improve navigation and make calls-to-action more compelling — all without relying on paid ads.
Behavioral analytics is a practical toolkit for building a more user-friendly site that keeps visitors returning. Let’s review the metrics that matter, the tools that track them and the step-by-step actions you can take to turn data into real growth.
What is behavioral analytics in a nutshell?
Behavioral analytics goes beyond basic clicks and page views, focusing on the reasons behind user actions. It helps you understand what holds visitors on the page, what catches their attention and what makes them stay (or leave). Instead of surface-level data, behavioral analytics provides a view into user motivations — what’s engaging, frustrating and driving action.
Behavioral analytics shows where users engage, helping boost interaction, retain visitors and drive conversions. With a clear view of what’s working and what needs adjusting, you can make data-driven decisions that build a site visitors want to explore.
Here’s how it supports organic growth:
- Improving UX: With a better understanding of user behavior, you can fine-tune your site’s flow and layout, making navigation straightforward and content enjoyable.
- Increasing engagement rates: By seeing where users linger, you can create content that holds attention and encourages more interaction.
- Reducing bounce rates: Find what keeps users on the page to hold their attention and reduce bounce rates.
- Boosting conversion potential: Identify what drives user actions so you can place CTAs strategically and create smooth interactions.
Behavioral analytics forms the foundation of a user-first approach, turning user data into actions that attract and retain visitors.
Dig deeper: Driving growth through data: Optimizing the retention stage
Behavioral analytics vs. traditional web analytics
Traditional web analytics and behavioral analytics each offer valuable insights, though they focus on different aspects of user activity. Traditional analytics covers the “what” — metrics like page views, bounce rates and conversion rates. Behavioral analytics, however, explores the “why,” giving a closer look at user motivations and actions.
For example, when a page has a high bounce rate, traditional analytics alerts you to the problem but doesn’t explain why users are leaving. Behavioral analytics dives deeper, tracking how users scroll, click or pause on the page. This information helps you address specific issues, making it easier to adjust content and create a natural journey for users.
With behavioral analytics, guessing is minimized. You receive a clear map of user actions that helps guide improvements, creating an experience aligned with users’ wants.
Key behavioral metrics every marketer should track
Behavioral analytics becomes most valuable when you focus on metrics that reveal user actions and engagement specifics. Start with these key metrics for maximum impact:
- Clicks and taps: Track where users click to understand what captures their attention. This data shows if your CTAs, buttons or links need adjustments to improve engagement.
- Scroll depth: Measure how far down each page users scroll. If only 20% of visitors reach your main CTA at the bottom, consider moving it higher. Scroll depth reveals whether users see your most valuable content.
- Navigation paths: Follow the journey users take from page to page to understand how they move through the site. If users get lost or exit early, this highlights areas where navigation can be simplified.
- Session duration and hotspots: These metrics show where users spend the most time. Long sessions on a blog post? That’s a content win. Short visits on a product page? It might be time to rethink the layout. Hotspots identify elements that work well and those that need improvement.
- Rage clicks and dead clicks: Rage clicks happen when users repeatedly click on something unclickable, signaling frustration. Dead clicks, which lead nowhere, point to elements that may need fixing or removal. Both metrics help uncover user pain points that could be driving visitors away.
Connecting metrics to organic growth goals
Each of these metrics supports specific organic growth goals.
For example, scroll depth and session duration reveal content engagement levels, positively impacting SEO. Tracking navigation paths and reducing rage clicks promotes user retention, creating a smoother experience.
Linking metrics back to KPIs like SEO rankings, engagement and retention helps shape a data-backed approach to organic growth based on real user behavior.
Helpful tools and techniques for behavioral analytics
Choosing the right tools is essential to capturing and understanding user behavior effectively. Here’s a look at popular tools that reveal valuable details about user actions, helping to improve engagement, navigation and conversions.
- Google Analytics: Known for its behavior flow feature, Google Analytics allows you to track user paths, showing where visitors enter, exit and engage on pages. Set up custom events, like scroll tracking or button clicks, to gain detailed behavioral data.
- Fullstory: Fullstory offers session replays that let you watch users’ interactions on your site, highlighting what attracts their attention and where they encounter obstacles. Its rage-click tracking pinpoints frustration points for better user experience design.
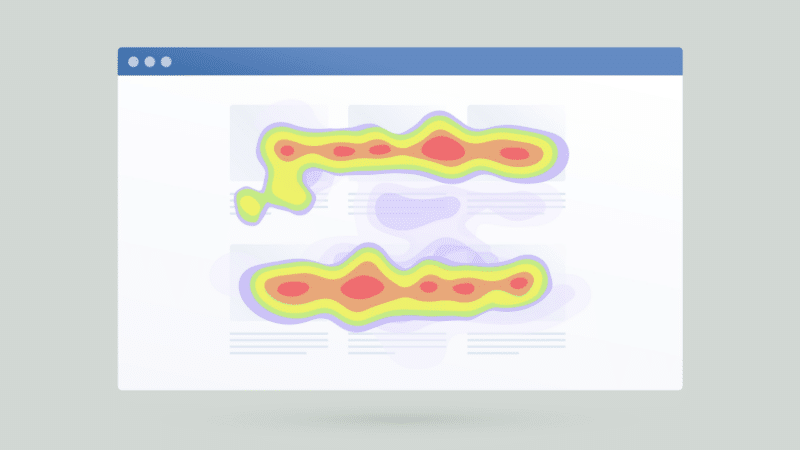
- Hotjar: Hotjar’s heatmaps and scroll maps provide a visual overview of user engagement, showing which areas get the most attention and how far users scroll. Use this data to strategically place CTAs and other key elements.
- Contentsquare: Contentsquare provides advanced zoning heatmaps and analytics, offering an in-depth analysis of user behavior, from click zones to scroll patterns. This data helps identify high-engagement areas and guides layout adjustments.
- Mouseflow: Mouseflow focuses on customer behavior analysis through interaction recordings, showing exactly how users navigate your site. Its heatmap and funnel tools highlight drop-off points and engagement barriers.
- Userpilot: Userpilot tracks how visitors interact with specific website features, helping shape customized user experiences. Its analytics and segmentation capabilities make it well-suited for creating targeted interactions for different user groups.
How to choose your behavioral analytics tool
Selecting the right tool starts with clearly understanding your goals and available resources. For insights into user flows and friction points, consider tools like Fullstory or Mouseflow. If layout and design are your focus, heatmap-centered tools like Hotjar or Contentsquare can provide visual data. Choose a tool that aligns with your goals and fits within your team’s capacity for a smooth setup and actionable results.
Setting up tracking
To begin gathering user behavior data, install tracking codes from your chosen tool. Place the code within the <head> section of each webpage or use integration options in your CMS to simplify the process.
Comply with GDPR, CCPA and other privacy laws by providing clear consent notifications and applying strong data protection measures. Accurate tracking setup supports data integrity and strengthens user trust.
Dig deeper: How to build customer trust through data privacy and security
Translating data into organic marketing strategies
After collecting behavioral data, the next step is to turn those findings into specific actions that enhance engagement and improve the user journey. Here’s how to use your data to refine content, optimize CTAs and streamline site structure.
Using behavioral data to inform content strategy
- Content prioritization: Identify content that consistently engages users and expand its reach. Repurpose it for other channels, update it with new information or create similar topics to capture more attention.
- CTA optimization: Analyze click and scroll depth data to check CTA visibility and effectiveness. If a CTA isn’t getting clicks, move it higher on the page or adjust the wording to make it more engaging.
- A/B testing headlines and layouts: Use your findings to test different headlines, layouts and CTA placements. Run A/B tests on important pages, compare versions and implement the highest-performing options to boost engagement and SEO.
Optimizing site structure and user flows
- Simplifying navigation: Check user paths to see if navigation helps or hinders users. Simplify it by removing unnecessary options and highlighting the most-visited pages, making it easier for users to find what they need.
- Improving internal linking: Connect high-engagement pages to other relevant content within your site. This approach supports SEO and keeps users engaged longer by guiding them through a structured journey.
Creating a data-driven organic marketing plan
Use your behavioral analytics findings to develop a measurable marketing plan. Set specific goals, like lowering bounce rates by 10% or increasing blog post engagement by 20%. Monitor these metrics regularly and adjust as needed to keep your strategies effective and aligned with user needs.
Dig deeper: The 4 types of content buyers want
How to implement behavioral analytics for organic growth
Ready to put behavioral analytics into action? Here’s a clear, step-by-step guide to get you started and set up for lasting success:
Step 1: Define organic growth goals
Set clear, measurable goals for your strategy. Focus on targets like increasing engagement by 20%, boosting time on page or reducing bounce rates. Defining specific goals keeps your analysis sharp and focused.
Step 2: Choose target metrics and tools
Identify the metrics that best support your goals. For example, to increase content engagement, track scroll depth, clicks and session duration. Then, choose tools that capture these metrics and fit within your team’s resources.
Step 3: Set up tracking on key pages
Install tracking codes on high-traffic pages, landing pages and conversion-focused pages where data insights can make a meaningful impact. Verify that tracking is properly set up on all target pages to collect reliable data.
Step 4: Gather data and establish benchmarks
Run analytics for a set period to create a baseline. This initial data provides a snapshot of current user interactions and sets benchmarks to measure progress and improvement over time.
Step 5: Make informed changes and test
Use your findings to make targeted changes on your site. Test new CTAs, adjust content placement or simplify navigation and track the results to see if they meet your goals. A/B testing tools can help determine which versions encourage the most engagement.
Step 6: Continuous optimization
Behavioral analytics isn’t a one-time task. Regularly review your metrics, observe new user patterns and make adjustments to keep improving. As user behavior shifts, align your site with their needs to support steady growth.
Overcoming common challenges in behavioral analytics
Behavioral analytics is powerful, so it’s important to understand some of the common challenges along the way. Here’s how to manage data overload, respect privacy and combine data for a well-rounded view.
- Handling data overload: Focus on metrics directly related to your goals. Ignore “nice-to-know” data and prioritize findings that directly impact growth.
- Respecting privacy compliance: Privacy laws like GDPR and CCPA require transparency in data practices. Always gather user consent, clearly communicate data use and build trust through solid data protection practices.
- Blending qualitative and quantitative data: While heatmaps and scroll depths provide numbers, session replays and user feedback add context. Combining both types of data gives a fuller picture of user actions, making it easier to understand user behavior.
Growing organic growth with behavioral data
Behavioral analytics helps marketers boost organic growth by analyzing user actions to create an engaging experience that naturally attracts and retains visitors.
Start by focusing on key metrics on high-impact pages to get quick results. As you build confidence, expand tracking and refine your framework.
With a methodical, data-based approach, you’ll be able to keep your site fresh and welcoming — creating a place users want to return to again and again.
Dig deeper: Reaching consumers in the age of AI: What you need to know about search and social media
The post How to grow your organic reach with behavioral analytics insights appeared first on MarTech.
**Leveraging Behavioral Analytics to Boost Your Organic Reach**
In today’s digital landscape, businesses are constantly seeking ways to increase their organic reach and engage with their target audience more effectively. With the ever-evolving algorithms of social media platforms and search engines, it’s no longer enough to simply create content and hope for the best. To stay ahead of the competition, marketers need to take a data-driven approach, and one of the most powerful tools at their disposal is **behavioral analytics**.
Behavioral analytics allows businesses to understand how users interact with their content, website, and digital platforms. By analyzing user behavior, companies can make informed decisions that optimize their strategies, ultimately leading to increased organic reach. In this article, we’ll explore how behavioral analytics can be leveraged to boost your organic reach and provide actionable insights to help you get started.
### What is Behavioral Analytics?
Behavioral analytics is the process of collecting and analyzing data on how users behave when they interact with your digital assets. This includes tracking actions such as clicks, scrolls, time spent on a page, navigation patterns, and conversions. The goal is to gain a deeper understanding of user intent, preferences, and pain points, which can then be used to improve user experience (UX), content relevance, and overall engagement.
Unlike traditional analytics, which may focus on aggregate metrics like page views or bounce rates, behavioral analytics delves into the specific actions users take. This allows marketers to identify patterns and trends that can be used to optimize content and marketing strategies.
### Why is Organic Reach Important?
Organic reach refers to the number of people who see your content without paid promotion. It’s a crucial metric for businesses because it reflects the effectiveness of your content in naturally attracting and engaging your audience. Organic reach is often considered more valuable than paid reach because it signifies that your content is resonating with users, leading to higher engagement, trust, and brand loyalty.
However, achieving and maintaining strong organic reach can be challenging due to factors such as algorithm changes, increased competition, and shifting user preferences. This is where behavioral analytics comes into play.
### How Behavioral Analytics Can Boost Organic Reach
1. **Understanding User Intent and Preferences**
One of the key benefits of behavioral analytics is that it helps you understand what your audience is looking for. By analyzing user behavior, you can identify which types of content resonate most with your audience. For example, you may discover that users engage more with video content than blog posts, or that certain topics generate more interest than others.
Armed with this knowledge, you can tailor your content strategy to align with user preferences, ensuring that you’re delivering the right content at the right time. This not only increases engagement but also signals to search engines and social media algorithms that your content is valuable, which can improve your organic reach.
2. **Optimizing User Experience (UX)**
A seamless and intuitive user experience is critical for retaining visitors and encouraging them to explore more of your content. Behavioral analytics can help you identify pain points in the user journey, such as high drop-off rates on specific pages or confusing navigation paths.
By addressing these issues and optimizing your website or app for a smoother user experience, you can reduce bounce rates and increase the time users spend on your platform. This, in turn, sends positive signals to search engines, which can improve your rankings and organic visibility.
3. **Personalizing Content for Different Segments**
Not all users are the same, and behavioral analytics allows you to segment your audience based on their actions and preferences. For example, you can create segments for users who frequently visit your blog, those who engage with your social media posts, or those who have made a purchase.
Once you’ve segmented your audience, you can create personalized content that speaks directly to the needs and interests of each group. Personalization is a powerful way to increase engagement and build stronger relationships with your audience, which can lead to more shares, comments, and organic exposure.
4. **Improving Content Distribution Strategies**
Behavioral analytics can also provide insights into how users discover and interact with your content across different channels. For example, you may find that certain social media platforms drive more traffic to your website, or that users are more likely to engage with your content at specific times of the day.
By analyzing these patterns, you can optimize your content distribution strategy to ensure that you’re reaching your audience where and when they’re most active. This can lead to higher engagement rates and, ultimately, increased organic reach.
5. **Identifying High-Performing Content**
Not all content is created equal, and behavioral analytics can help you identify which pieces of content are driving the most engagement and conversions. By analyzing metrics such as click-through rates, time on page, and social shares, you can determine which content is resonating with your audience and which may need improvement.
Once you’ve identified your top-performing content, you can repurpose it for

Recent Comments