

The influencer marketing sector is changing rapidly. Performance metrics, campaign types, and content objectives that established success last year might lose their effectiveness by 2025. To keep you updated on the industry’s latest strategies and trends, we have gathered these 29 crucial influencer marketing statistics.
Covering six different categories, this compilation provides a concise overview of the current landscape, leading social media platforms, criteria for crafting effective influencer marketing campaigns, and much more.
The 2024 Influencer Marketing Report
This compilation features influencer marketing statistics from the Sprout Social 2024 Influencer Marketing Report. It serves as a comprehensive report that includes consumer expectations, purchasing behaviors, brand collaborations, and long-term forecasts. We will also reference data from the Q1 2025 Sprout Pulse Survey data.
Influencer marketing growth statistics
Over the years, influencer marketing has been consistently expanding and shows no signs of slowing down. Explore these growth statistics to gain insights into the industry and its outlook for the future of social media.
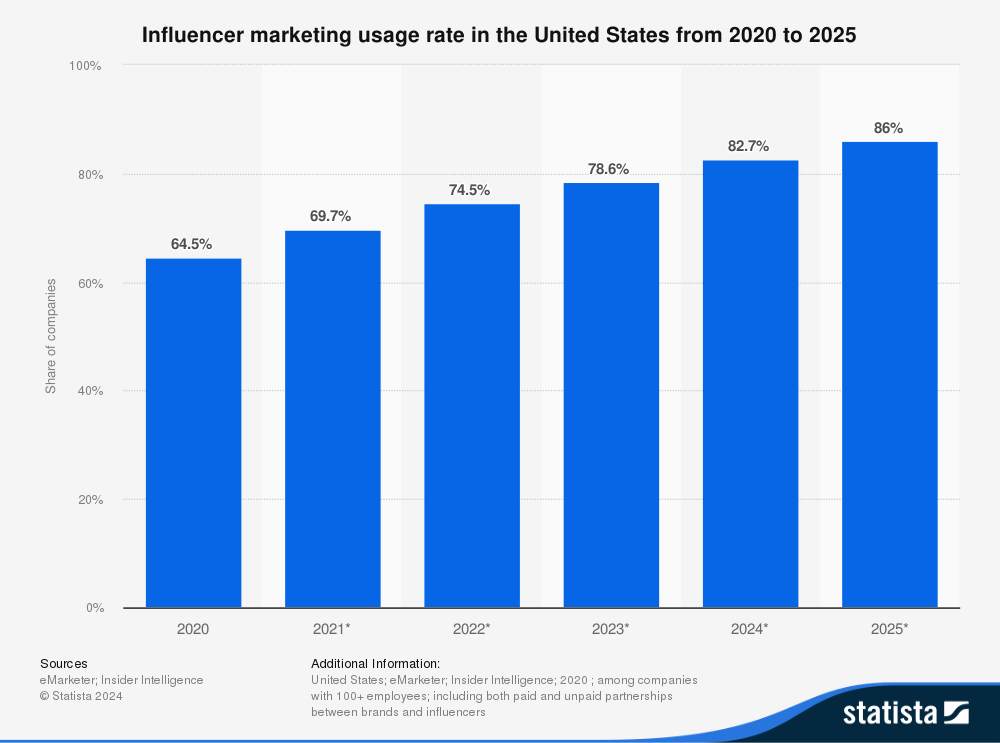
1. 86% of US marketers plan to collaborate with influencers in 2025
In 2021, close to 70% of US marketers from companies with more than 100 employees were projected to adopt influencer marketing. This figure has steadily increased and is forecasted to hit 86% by 2025.
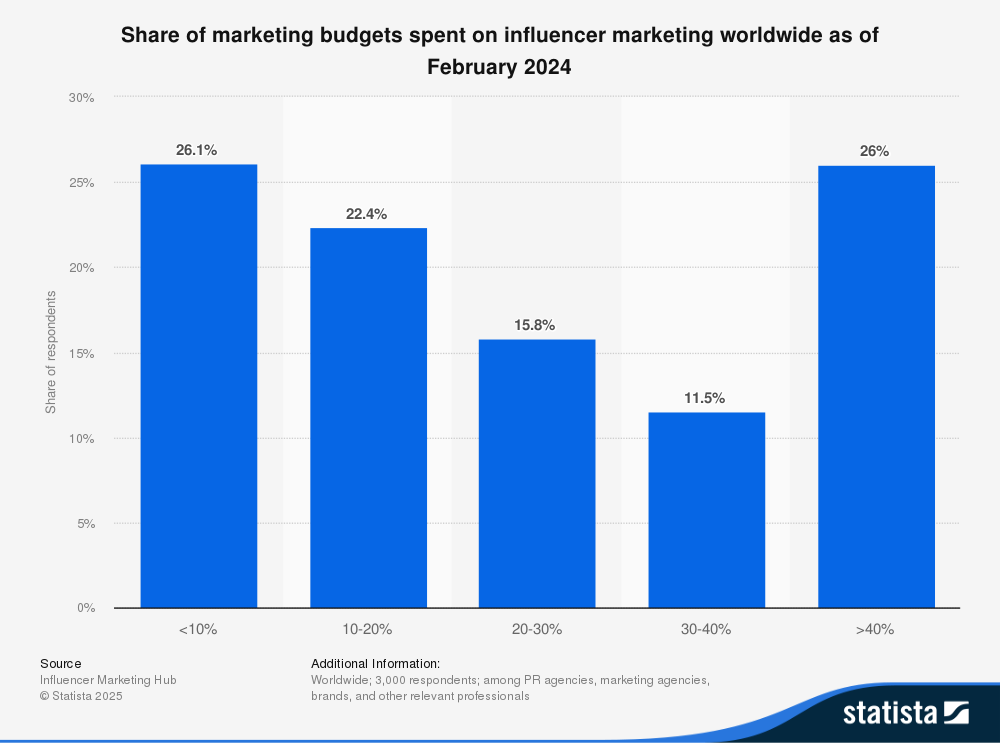
2. 26% of marketing agencies and brands invest more than 40% of their marketing budgets into influencer marketing globally
As of February 2024, 26% of marketing agencies and brands worldwide have dedicated over 40% of their budgets to influencer marketing initiatives. Interestingly, 26.1% of these entities have allocated less than 10%. Both segments have increased year over year, potentially indicating a rising divide in attitudes toward influencer marketing budgets.
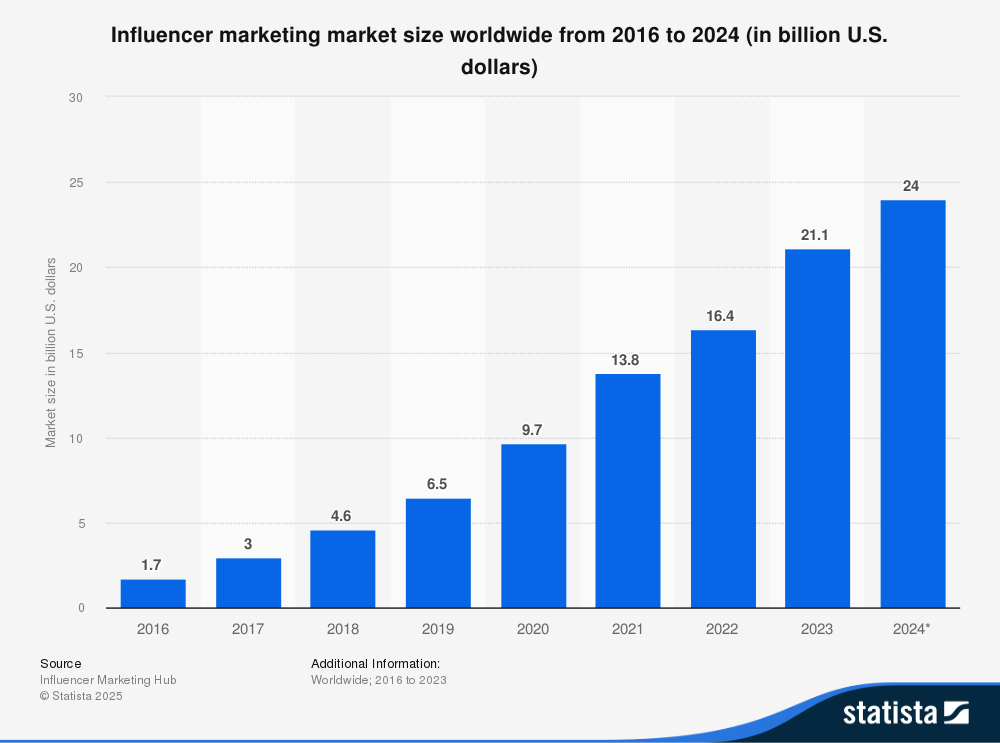
3. The influencer marketing industry was valued at $24 billion in 2024
The value of the influencer marketing industry was merely $1.7 billion in 2016. It rose to $16.4 billion in 2022 and expanded to $24 billion by 2024. This remarkable growth signifies the vitality of this domain.
4. Instagram remains the top platform for influencer marketing globally
More than half of brands (57%) consider Instagram to be their go-to social media platform for influencer collaborations. TikTok closely follows, favored by 52% of brands. Thirty-seven percent opted for YouTube, 28% for Facebook, and 12% for LinkedIn.
5. The global influencer marketing platform industry is projected to approach $33 billion by 2025
Influencer marketing platforms aid in identifying influencers and building partnerships with brands, drafting contracts, campaign planning, and more. Thus, it’s no surprise that the value of these platforms is also increasing, with expectations to reach $33 billion by 2025.
Influencer marketing effectiveness statistics
Creating a successful influencer marketing campaign involves various elements. Finding niche influencers, effectively reaching target audiences, and choosing the appropriate content format and briefing approach may require some trial and error. The following effectiveness statistics will assist you in pinpointing the components that make a campaign work.
6. 65% of influencers want creative involvement
Data from the Sprout Social 2024 Influencer Marketing Report reveals that 65% of influencers prefer engaging in creative or product development discussions with brands early in the process rather than adhering to a strict brief. Influencers are acutely aware of internet culture’s nuances, making them suitable for identifying what messages will connect with their followers.
7. Marketers assess performance via engagement and link traffic, while influencers focus on audience expansion
According to the same Sprout Influencer marketing report, influencers evaluate their performance through metrics such as social media engagement, audience growth, and link traffic. Marketers measure slightly differently, tracking influencer marketing performance through social media engagement metrics (68%), link traffic from posts (50%), and increased website traffic during campaigns (45%).
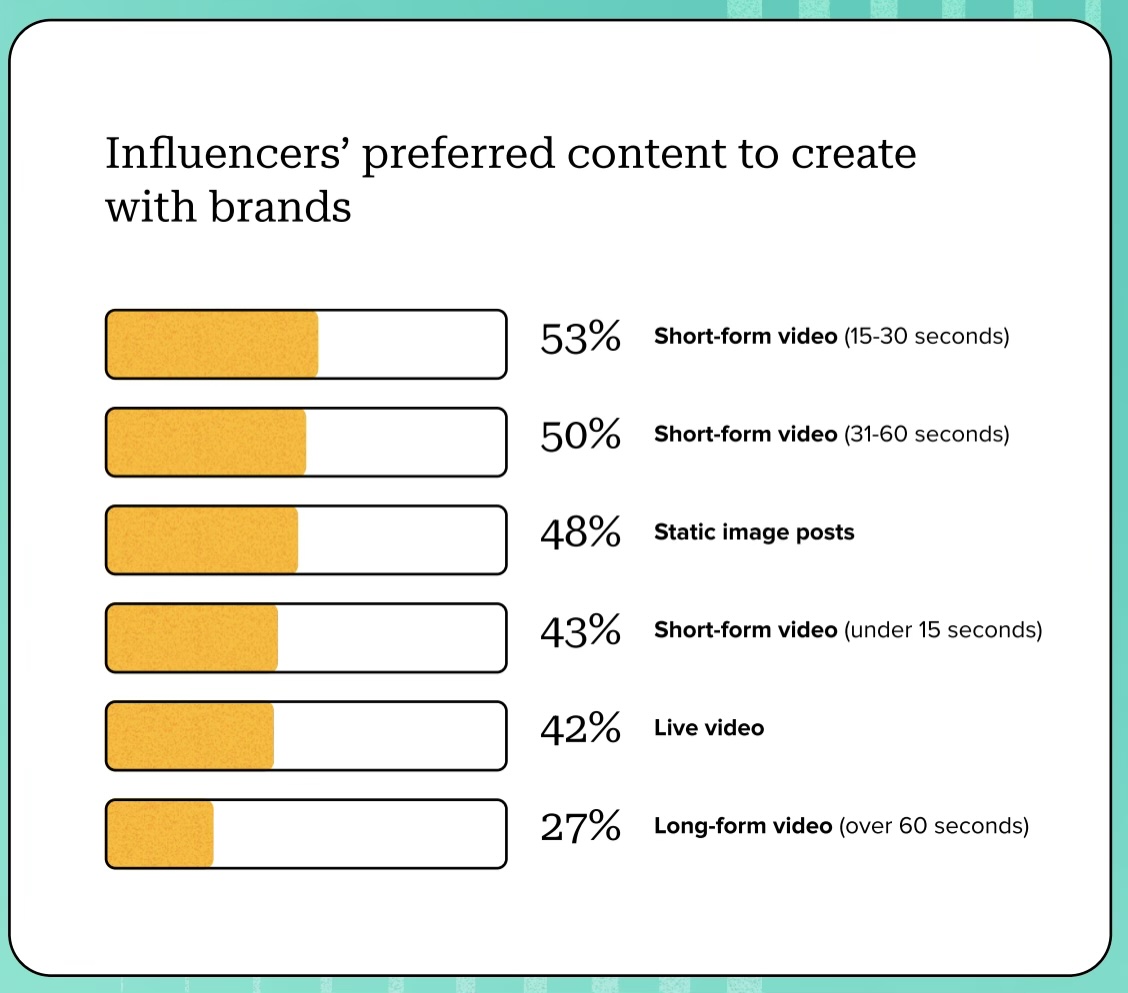
8. Influencers prefer collaborating on short videos, giveaways, and product partnerships
In the 2024 Influencer Marketing Report, when asked about their favorite content format for brand collaborations, 53% of influencers selected short-form videos that are 15-30 seconds long, with only 5% favoring evergreen activations.
9. 67% of consumers believe that honesty and fairness are crucial to effective brand and influencer collaborations
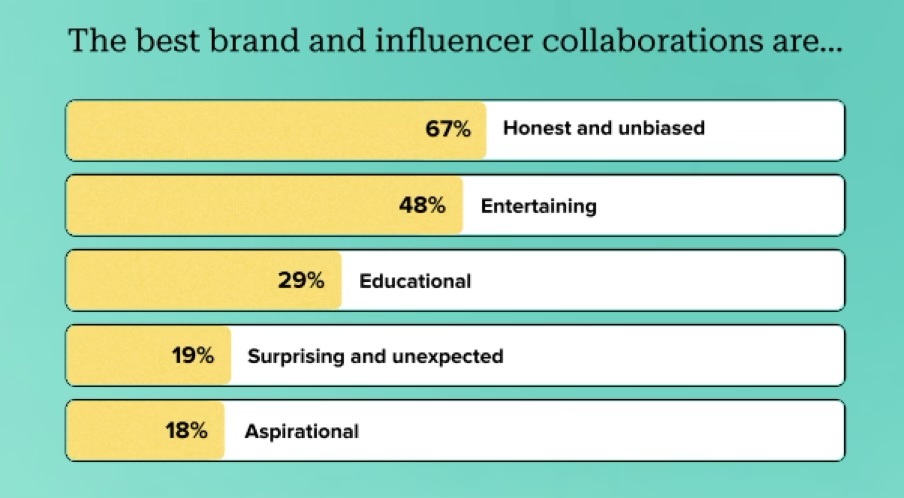
Data from the Consumer Expectations section of the Influencer Marketing Report illustrates that across demographics, influencer collaborations are likely to capture attention if they are viewed as honest and unbiased (67%) and entertaining (48%). On the contrary, consumers find educational (29%), surprising (19%), and aspirational content (18%) less compelling.
Influencer marketing ROI statistics
Budgets for influencer marketing are currently at unprecedented levels, but what returns are brands seeing from their influencer initiatives? Here are some ROI statistics derived from Sprout Social’s latest influencer marketing report to help quantify and enhance the effectiveness of your upcoming campaigns.
10. Developing long-term relationships with influencers can reduce costs for brands
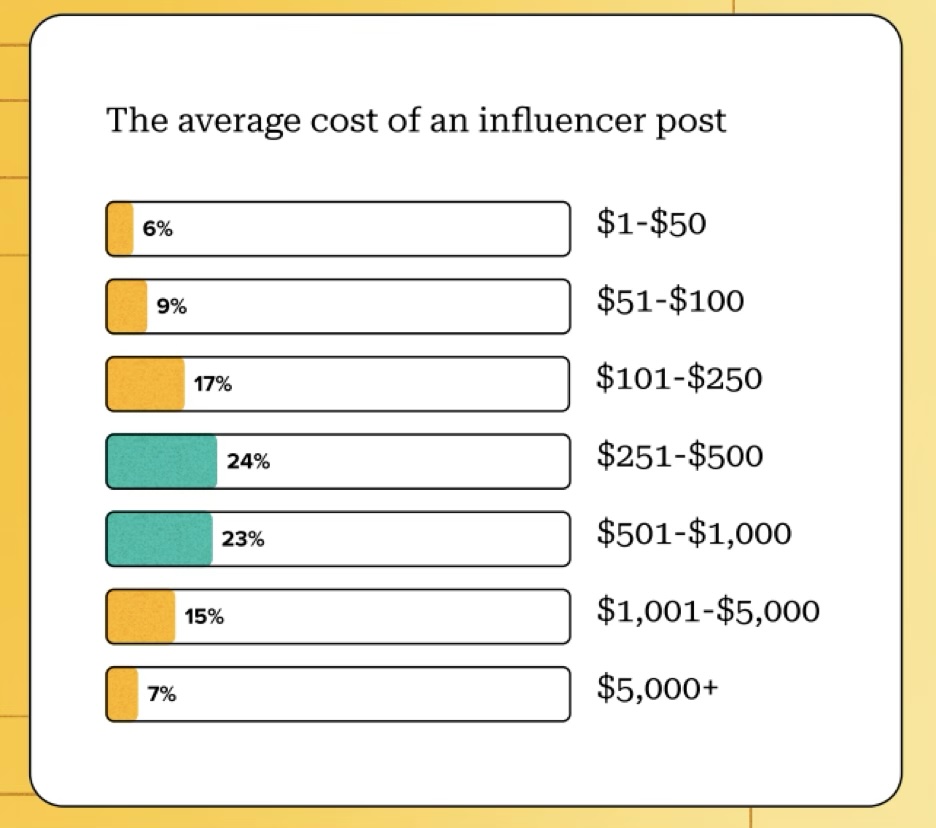
The 2024 Influencer Marketing Report indicates that half of influencers charge between $250-$1,000 per post; however, 71% provide discounts for prolonged collaborations, while another 25% are open to this option in the future. This highlights the benefits of long-term influencer-brand collaborations.
11. 86% of consumers make at least one purchase annually influenced by an influencer
Findings in the Buying Behaviors section of the 2024 Influencer Marketing Report reveal that 16% of consumers view influencer marketing as the greatest influence on their purchasing choices; however, influencer content ultimately drives nearly half (49%) of consumers’ purchases made daily, weekly, or monthly. Moreover, an overwhelming 86% of consumers report making at least one purchase based on influencer guidance each year.
12. 64% of consumers feel that authentic reviews are the most effective influencer content
The leading qualities of influencer content that persuade users to buy from a brand include authentic reviews (64%) and discount codes (55%). This indicates that a successful influencer marketing plan in 2025 should involve encouraging influencers with overlapping audiences in the same niche to provide authentic reviews and special offers to their followers.
13. 62% of regular buyers are inclined to offer product feedback to influencers
Influencer marketing ROI is not just limited to heightened website traffic and conversions. Insights into consumer behavior from the 2024 Influencer Marketing Report indicate that 29% of consumers share product feedback with influencers. This figure rises to 41% among Gen Z consumers and 62% among frequent buyers.
This suggests that consumers are involving influencers in the product feedback process. If your support teams and marketers are not actively engaging with influencers to gather and respond to this feedback, you risk overlooking valuable customer insights.
14. B2C brands typically collaborate with several influencers simultaneously
Sprout Social’s Q1 Pulse data indicates that B2C brands are more prone to work with multiple influencers concurrently, with 52% collaborating with 6-10 influencers and 23% partnering with 11-19 at a time.
B2B influencer marketing statistics
B2B influencer marketing is poised for significant growth in 2025. Brands shaping their strategies can draw lessons from both successes and challenges highlighted in the following B2B influencer marketing statistics.
15. 49% of B2B marketers anticipate influencer content to trend in 2025
Close to 50% of B2B marketers see integrating influencer content within marketing strategies as a primary trend to monitor in 2025.
16. 58% of B2B marketing teams employ a consistent influencer marketing strategy
A consistent approach enables brands to build lasting bonds with their influencers and audience. Nearly three-fifths of B2B marketing teams have adopted a consistent influencer marketing strategy. Those not utilizing this approach are 17 times more likely to report their initiatives as somewhat or very ineffective. Conversely, 99% of teams employing a consistent approach rate their efforts as effective.
17. 67% of B2B brands utilize influencer marketing to enhance brand visibility, and 54% to improve credibility and trust
Data from Sprout Social’s Q1 2025 Pulse Survey indicates that boosting brand visibility is the primary goal of influencer marketing for a majority of B2B brands (67%). Other key objectives include enhancing credibility and trust (54%), increasing audience engagement and customer loyalty (37%), contributing to product development and co-creation (29%), and fostering revenue growth (24%).
TikTok influencer marketing statistics
While US brands need to stay aware of the future of TikTok, the platform continues to be a significant player in influencer marketing on a global scale. TikTok influencers achieve some of the highest engagement rates, making the platform excellent for converting niche audiences into devoted customers. Below are TikTok influencer marketing statistics to inspire your future campaigns.
18. 27% of Gen Z users engage with influencers on TikTok
The 2024 Influencer Marketing Report indicates that while 15% of Gen Z users interact with influencers across social media, over a quarter (27%) specifically engage with influencers on TikTok.
19. There are over 100,000 TikTok influencers in the US
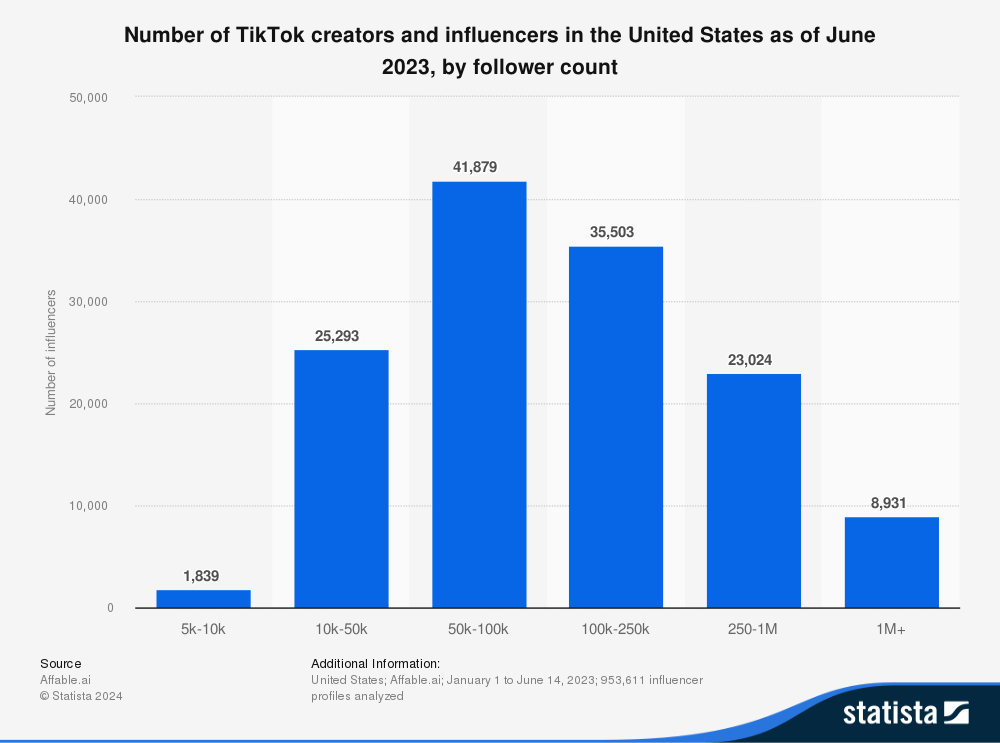
As of June 2023, there were over 100,000 TikTok influencers in the United States, spanning follower counts from 5,000 to over 1,000,000. With the growth of TikTok users in the US from 150 million in March 2023 to 170 million in January 2024 (and 2 billion worldwide), the platform likely hosts even more influencers from the United States.
20. 88% of TikTok users are nano-influencers
The majority (87.68%) of TikTok influencers are nano-influencers with fewer than 10,000 followers. The average engagement rate for TikTok nano-influencers is 10.3%—this rate exceeds the 7.1% engagement rate observed among the platform’s mega-influencers.
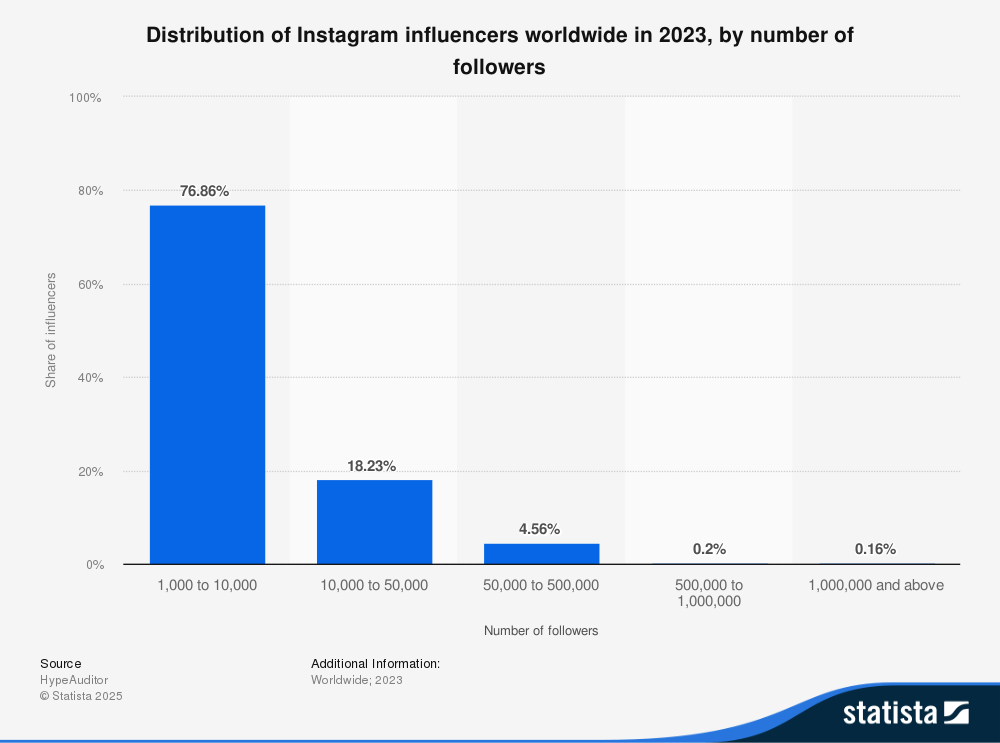
Similarly, most Instagram influencers (76%) are nano-influencers, but they achieve an average engagement rate of 1.73% (more than eight points lower than their TikTok peers).
21. 54% of TikTok users are under 24 and 56% are female
More than half of TikTok users are females under 24 years old. Generation Z is on track to become the largest, wealthiest, highest-spending generation ever. In 2024, this cohort constituted nearly 25% of the global population and accounted for 17% of consumer expenditure. By 2030, Gen Z is expected to be the largest segment of consumers, representing 19% of total spending.
When combined with the economic influence wielded by contemporary female consumers, this information makes influencer marketing on TikTok an exceptional avenue for brands targeting younger women.
22. The beauty sector dominates discussions on TikTok, but food and drink achieve the highest engagement rates
According to The 2024 Influencer Marketing Benchmarks Report, beauty is the leading topic on TikTok, generating 3.63 million posts with a 2.46% engagement rate. The food and drink sector also deserves attention; despite having fewer posts (1.05 million), it boasts the highest engagement rate at 3%.
Instagram influencer marketing statistics
Instagram influencer marketing is an essential strategy for many brands, especially given that most marketers believe it to be the prime influencer marketing platform. Delve into the current state of influencers on this social network with these Instagram influencer marketing statistics.
23. 77% of Instagram influencers globally have fewer than 10,000 followers
The vast majority of Instagram influencers are categorized as nano-influencers, possessing less than 10,000 followers.
24. Gen X and Millennials are almost twice as likely as Boomers to engage on Instagram
The 2024 Influencer Marketing Report highlights that Gen X and Millennials are nearly twice as likely to engage with content on Instagram compared to Boomers, making it an optimal platform to reach Gen X and Millennial audiences.
25. The fashion niche leads on Instagram
Instagram stands out as the premier platform for fashion-related influencer activity. According to our 2024 Influencer Marketing Benchmark data, this niche generated 35.8 million posts with an average engagement rate of 1.59%.
26. Sport-related content garnered the most engagement on Instagram in 2023
Influencers focusing on sports and fitness achieved the highest engagement on Instagram in 2023. Data from The 2024 Influencer Marketing Benchmark Report shows this segment accumulated 17.8 million posts with an engagement rate of 2.31%.
27. 79% of Reels viewers have made a purchase after seeing a Reel
Instagram Reels provide an excellent format for boosting conversions. According to survey data, 79% of weekly Reels viewers purchased a product or service after encountering it in a Reel.
YouTube influencer marketing stats
Lastly, let’s examine YouTube influencer marketing statistics and what its influencers entail.
28. 51% of YouTube users prefer interacting with a brand’s long-form videos
Findings from The 2024 Social Media Content Strategy Report indicate that over half of YouTube users favor engaging with long-form brand videos (exceeding 60 seconds), with videos between 31-60 seconds being the second choice. From the perspective of influencer collaborations, YouTube offers a platform for brands to conduct more extensive activations.
29. The top three YouTube categories globally are gaming, sports and fitness, and fashion
As reported in The 2024 Influencer Marketing Benchmarks Report, the categories generating the most content on YouTube are gaming (1.24 million posts), sports and fitness (650K posts), and fashion (549K posts). The travel category, despite only having 146K posts, enjoyed the highest engagement rate on the platform at 1.83%.
Stay updated with influencer marketing statistics
Keeping abreast of the newest influencer marketing statistics is an effective method to enhance the impact of your influencer campaigns. Looking to elevate your influencer marketing strategy even further? Consider utilizing these influencer marketing tools to assist your team in identifying niche influencers, developing campaigns, and establishing lasting relationships with both influencers and their audiences.
The post 29 influencer marketing statistics to guide your brand’s strategy in 2025 appeared first on Sprout Social.

Recent Comments