

Should your company prioritize Facebook? Are your advertisements and content reaching the appropriate audience?
Remaining informed about the latest social media metrics for Facebook can provide valuable insights!
Despite the rise of other platforms, Facebook continues to be the leading social media site. The size and profile of its user base in 2025 might astonish you, especially in comparison to competing services.
This article examines important Facebook marketing metrics, including fresh insights on demographics, usage, and marketing, among others.
Three Essential Facebook Statistics for Marketers
- As of 2025, Facebook ranks as the third most-visited site after Google and YouTube, sitting ahead of other popular platforms like TikTok and Instagram.
- The site has an impressive 3.06 billion active monthly users, confirming its status as the most widely used social media platform globally.
- In 2024, Facebook’s total advertising revenue reached $164.5 billion, an increase from $134 billion the previous year.
Facebook Usage Metrics
Facebook is synonymous with social networking. It remains the largest social platform, widely recognized and used globally by consumers and marketers.
Let’s start with significant Facebook usage statistics that can enhance your understanding of its reach and refine your own Facebook marketing approach:
1. In 2024, Facebook recorded 3.065 billion monthly active users
By Q2 2024, monthly active users on the platform grew to 3.065 billion after crossing the 3 billion mark the prior year.
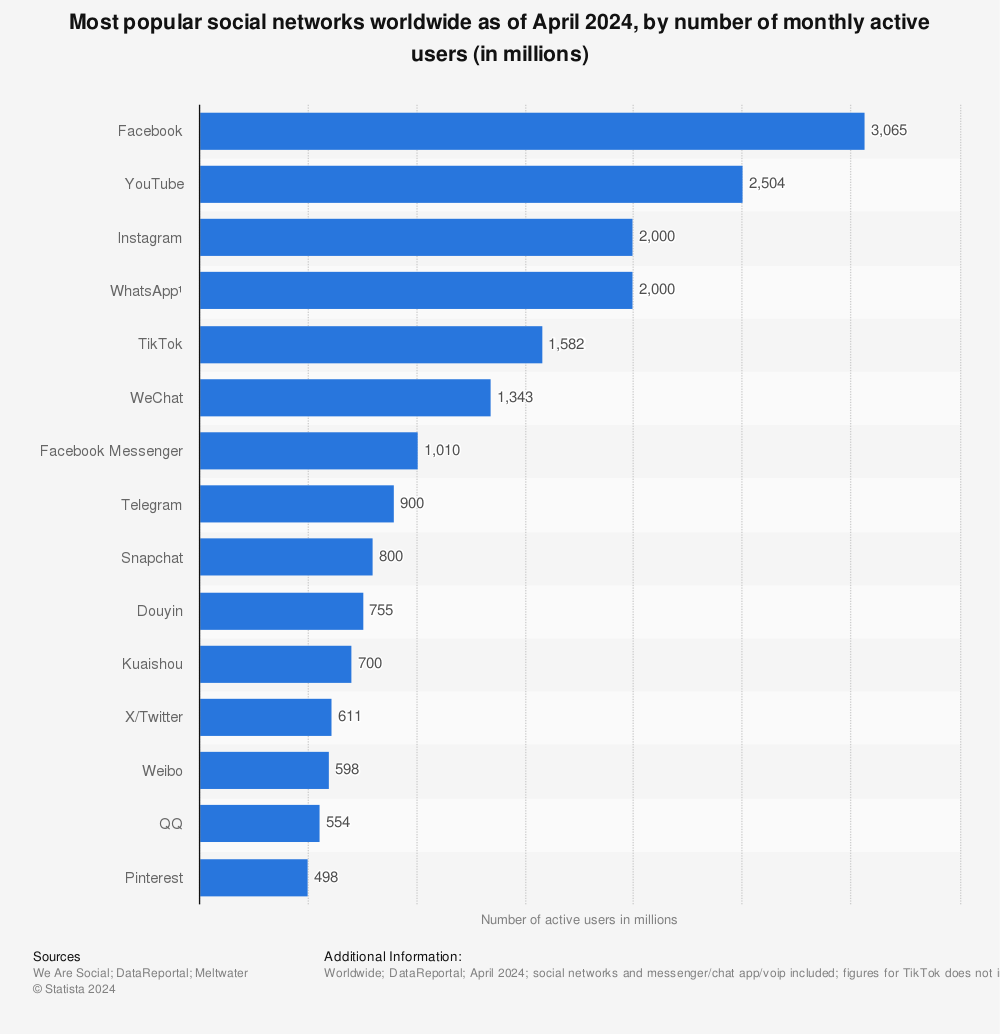
While growth has tapered, both monthly and daily usage continue to trend upward. If your marketing strategies feel stagnant, consider downloading our Facebook marketing template to refresh your plan.
2. Americans spend about 30.8 minutes on the platform each day
On average, American users allocate around 30.8 minutes daily to Facebook, which is less than the time spent on platforms like TikTok, Instagram, and even X. These figures indicate that while the platform maintains solid usage rates, daily engagement is relatively lower compared to others.
Facebook User Insights
Facebook may boast billions of users, yet how are they interacting with the platform? These statistics shed light on user behavior:
3. 3.35 billion users engage daily across the Facebook app family
According to Meta, 3.35 billion individuals spend time daily on its suite of applications, including Facebook, Instagram, and Messenger.
Believe it or not, there are billions of potential customers your brand could connect with every single day through Facebook. The challenge lies in understanding the Facebook algorithm to enhance your organic reach.
4. 90% of social media users have a Facebook account.
While many social networks are fleeting, Facebook remains a fundamental platform for regular users.
The recent Sprout Social Index reveals that Facebook is the favored social network among surveyed consumers. Most respondents stated they would choose Facebook if limited to one social media platform.

5. Facebook is the leading site for news consumption
The growth of social media as a key information source isn’t new.
However, it may come as a surprise that Facebook stands as the primary social media outlet for news consumption.
Whether it’s local news or current events, close to two-thirds of users (63%) depend on the platform for their news updates.
6. Facebook ranks as the second top platform for discovering products
Recent statistics underscore Meta’s strong influence in social commerce.
Facebook (60%) is second only to Instagram (61%) as the most favored platform for product discovery, according to our findings . Given the surge of advertisements across Meta’s suite, this trend is logical.
Interesting note: Sprout Social also discovered that nearly 40% of Gen X consumers utilize the platform for shopping. It’s clear that Facebook is still a primary site for social product discovery.
7. 44% of Facebook users engage with brand content on the platform at least once daily
Social media is frequently utilized for customer support and care inquiries.
Though primarily a social platform, Facebook serves as an excellent venue for delivering customer support and enhancing user experiences with your brand. Our analysis indicates that 76% of consumers notice and appreciate businesses that emphasize customer support, no matter the network.
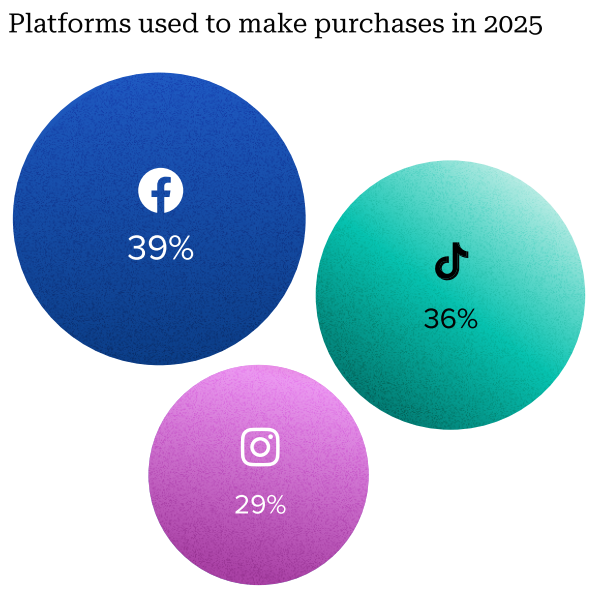
8. Facebook is expected to convert 38.5% of US users into buyers this year
According to eMarketer, US adults are increasingly inclined to make purchases directly on Facebook in 2025. However, this places them behind TikTok (45.5%) and marginally ahead of Instagram (37.3%).
In light of the growth of TikTok Shop, this metric might not come as a surprise. Nevertheless, Facebook still maintains its own social commerce powerhouse with Facebook Marketplace.
9. 40% of Facebook’s user base shops actively on Facebook Marketplace
Insights from Capital One illustrate the rise of Facebook Marketplace with millions of users (and billions of transactions). The report also highlights that about 16% of active Facebook users exclusively engage with Marketplace features.
Audience and Demographics Insights on Facebook
audience on Facebook? What if your target demographic isn’t present on the platform at all?
Here’s a selection of Facebook statistics that outline the core audience and demographic composition:
11. Gen X constitutes the largest segment of Facebook’s audience
Recall when we mentioned that 90% of consumers have a Facebook account? Gen X primarily uses Facebook, followed by Baby Boomers and Millennials. This contrasts with Gen Z, who are more likely to favor Instagram (89%), YouTube (84%), and TikTok (82%) profiles instead.
12. Facebook is the go-to customer care platform for Millennials, Gen X, and Baby Boomers
Facebook enables users to directly interact with businesses through Messenger, Groups, Events, and more. This is why it’s the top channel for customer service among Millennials, Gen X, and Baby Boomers.
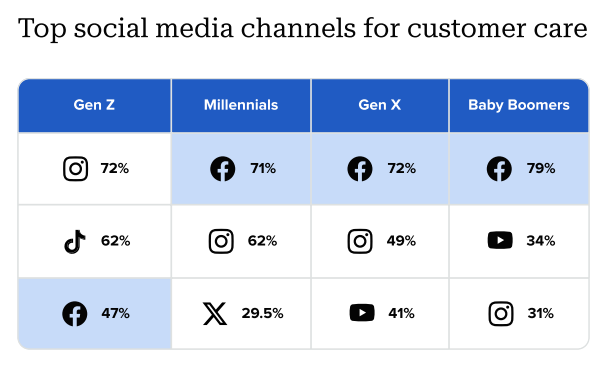
Maintaining a presence on this platform is crucial, regardless of your target demographic. With 73% of consumers indicating they will turn to a competitor if they don’t receive prompt customer care, it’s vital for brands to not overlook Facebook as a service avenue.
13. Mothers in the US spend 2.3 times longer on Facebook than on TikTok
Recent Comscore data from eMarketer reveals that mothers across various demographics are deeply engaged with Facebook and Messenger. Mother-oriented Facebook groups dominate the platform, which may seem surprising given the flourishing #MomTok and specialized communities on alternative platforms.
14. There are more male users than female on Facebook
Facebook currently categorizes its user base as male and female. Data indicates a higher proportion of male users (56.8%) compared to female users (43.2%).
15. India has the largest user base on Facebook
Although Facebook enjoys significant usage across multiple nations, India leads in the sheer number of users. Recent reports indicate that there are 378.05 million Facebook users in India, followed by the United States with 193.8 million users.
Insights on Facebook Advertising and Marketing
Is marketing on Facebook still valuable? And are you maximizing your advertising strategies on Facebook? Explore these advertising statistics to understand the platform’s impact.
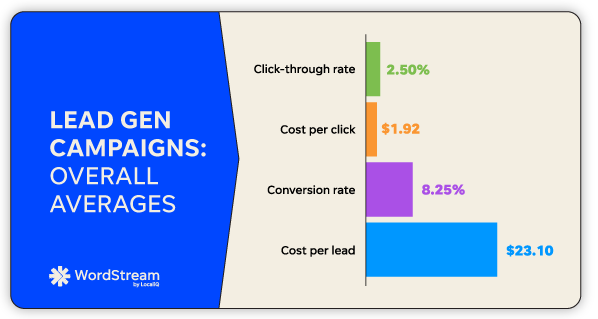
16. Facebook ads achieve an average click-through rate (CTR) of 2.53%
A recent WordStream analysis shows that Facebook ads yield an average CTR of 2.53% across all sectors for lead generation ads. However, click-through rates vary among industries, with arts & entertainment and real estate showcasing some of the highest figures.
Facebook traffic ads and campaigns display a lower CTR, averaging 1.57% across all fields. Sectors such as arts & entertainment, real estate, restaurants & food, and travel experience a CTR exceeding 2%.
17. The average cost per click (CPC) for traffic campaigns on Facebook is $0.77
The same research indicates that the average CPC is $0.77 across all industries for traffic advertising, trending down from the previous year. For lead generation ads, the average CPC stands at $1.88, also slightly lower than last year’s $1.92.
However, costs may spike significantly in particular sectors or advertisement types. For instance, lead generation ads can see CPCs over $8 for attorneys and $4 for healthcare providers.
18. Facebook maintains an average conversion rate of 8.78% across industries
Facebook demonstrates a robust conversion rate for its advertisements. Users can typically anticipate around an 8.78% conversion rate for their ads, though specifics differ by sector. Dental services, industrial & commercial, and real estate frequently show enhanced conversion metrics.
19. Facebook ranks among the top three platforms for ROI for marketers
With elevated conversion rates and low CPC, Facebook marketing delivers high returns. Indeed, 40% of marketers identify Facebook as one of their top three platforms for ROI in social media.
Engagement Statistics on Facebook
Amid decreasing organic visibility on Facebook, it’s normal to see reduced engagement rates as well.
But does this circumstance disadvantage Facebook compared to other social media platforms?
Here’s a brief overview of essential statistics that illustrate Facebook engagement today:
20. The average engagement rate on Facebook is 0.063%
Insights from a SocialInsider study reveal that brands experience a median engagement rate of 0.015% on Facebook, positioning it among the less engaging social media options, closely following X.
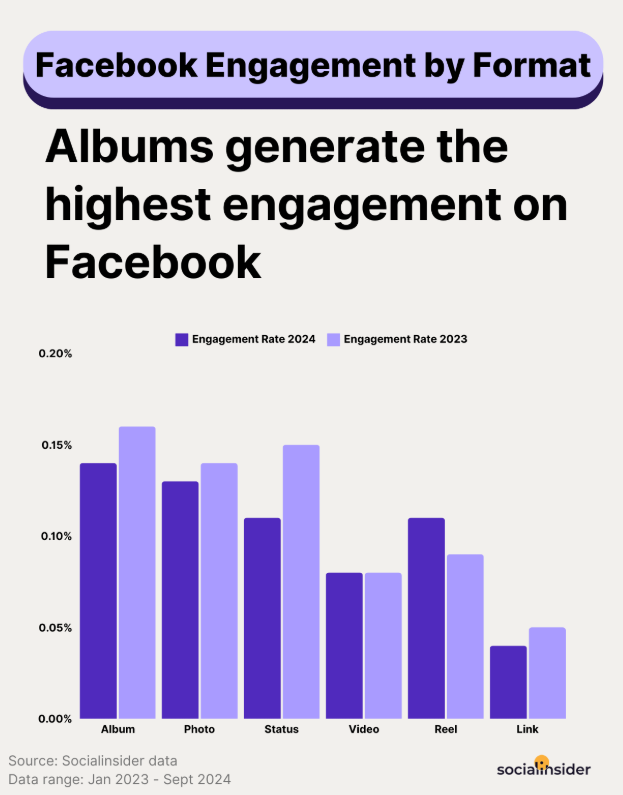
21. Albums and photo posts yield the highest engagement
The significance of visual content remains clear on Facebook, where album posts achieve nearly 0.15% engagement. Video posts follow closely with an average engagement of 0.12%. Status updates also perform decently, averaging 0.11% engagement. Conversely, link posts tend to generate the least engagement, averaging just 0.04%.
22. Posting frequently does not guarantee higher engagement
Contrary to common belief, higher posting frequency doesn’t automatically translate to increased engagement. As indicated in a RivalIQ study, influencers and higher education sectors achieve greater engagement compared to their posting rates.
For instance, influencer accounts may post just around 4 times weekly yet still achieve high engagement averages. In contrast, higher education institutions post more than six times a week yet see similar engagement levels.
The lesson here? Focus on your audience and industry rather than adhering to a set posting frequency.
Instead of prioritizing how often you post, timing should play a significant role in your strategy. Knowing the optimal times to post on Facebook increases your chances of driving engagement.
Video Statistics for Facebook
With the rise of video marketing, it’s critical to understand video performance on Facebook. Here are some key Facebook video statistics to elevate your strategy:
23. Users spend 40% of their time on Facebook and Instagram watching videos
Despite the explosion of short-form video platforms such as TikTok, users reportedly spend around 40% of their time on Facebook (and Instagram) engaged with video content. This indicates that your audience likely interacts with videos on the app, and producing Reels could extend your reach. If you’re in need of a refresher, we’ve devised a quick guide on establishing a successful video marketing strategy.
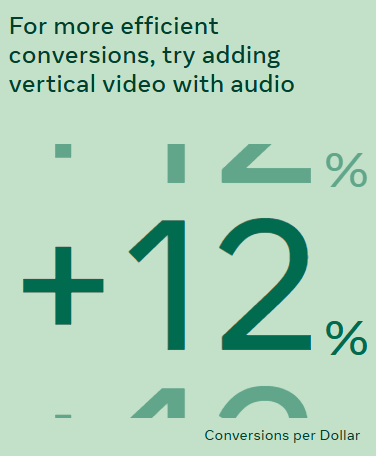
24. Vertical videos with audio present a 12% higher conversion rate
Reels have proven popular on Facebook since they were introduced and incorporated into the app from Instagram. Meta discovered that vertical videos (Reels) including audio yield a 12% higher conversion rate compared to other types of video content on the platform.
Statistics on Facebook Features (Reels, Stories, Messenger)
What types of content should you produce? Which features are thriving, and which are stagnant? Let’s explore statistics about key Facebook features such as Facebook Stories, Reels, and Messenger:
25. Facebook Stories are used daily by over 500 million people
As per internal Facebook data, over half a billion individuals utilize Facebook Stories each day, with more than 1 billion Stories shared daily across Meta’s platforms. Additionally, the feature draws in over 4 million advertisers monthly.
This demonstrates its popularity, making it a valuable tool for brands keen to engage their followers.
26. Facebook Messenger has 194 million users in the US
Independently, Facebook Messenger has amassed 194 million users in the US as of January 2025. That’s nearly 200 million individuals you might reach through Messenger ads.
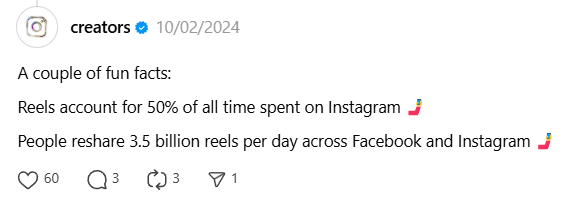
27. Users share 3.5 billion Reels daily across Facebook and Instagram
The appeal of Reels shows no signs of waning.
Previously, we noted that Reels commanded around 200 billion views daily across Meta platforms. Fast forward to 2025, and around 3.5 billion Reels are shared daily within Meta.
With algorithms continuing to push this format, Reels can boost your visibility and engagement significantly. Brands cannot afford to overlook this short-form video opportunity.
Statistics on Facebook Influencers
Facebook continues to serve as a significant platform for influencer marketing, but what does its performance look like? Though the platform provides vast reach, engagement rates are generally lower than those on video-focused platforms like TikTok and Instagram. We’ve identified the most critical insights from Sprout Social Influencer Marketing data on engagement, cost per post, and audience interactions.
28. Facebook influencer engagement rates lag behind other platforms
Engagement rates are key metrics for gauging influencer marketing success, as they reveal how audiences respond to content.
These rates vary by post type:
- Reels outshine all other forms of content with an average engagement rate of 0.23%.
- Video posts generated a 0.17% engagement rate.
- Photo posts performed at 0.08% engagement.
- Text posts saw the lowest engagement at an average of 0.07%.
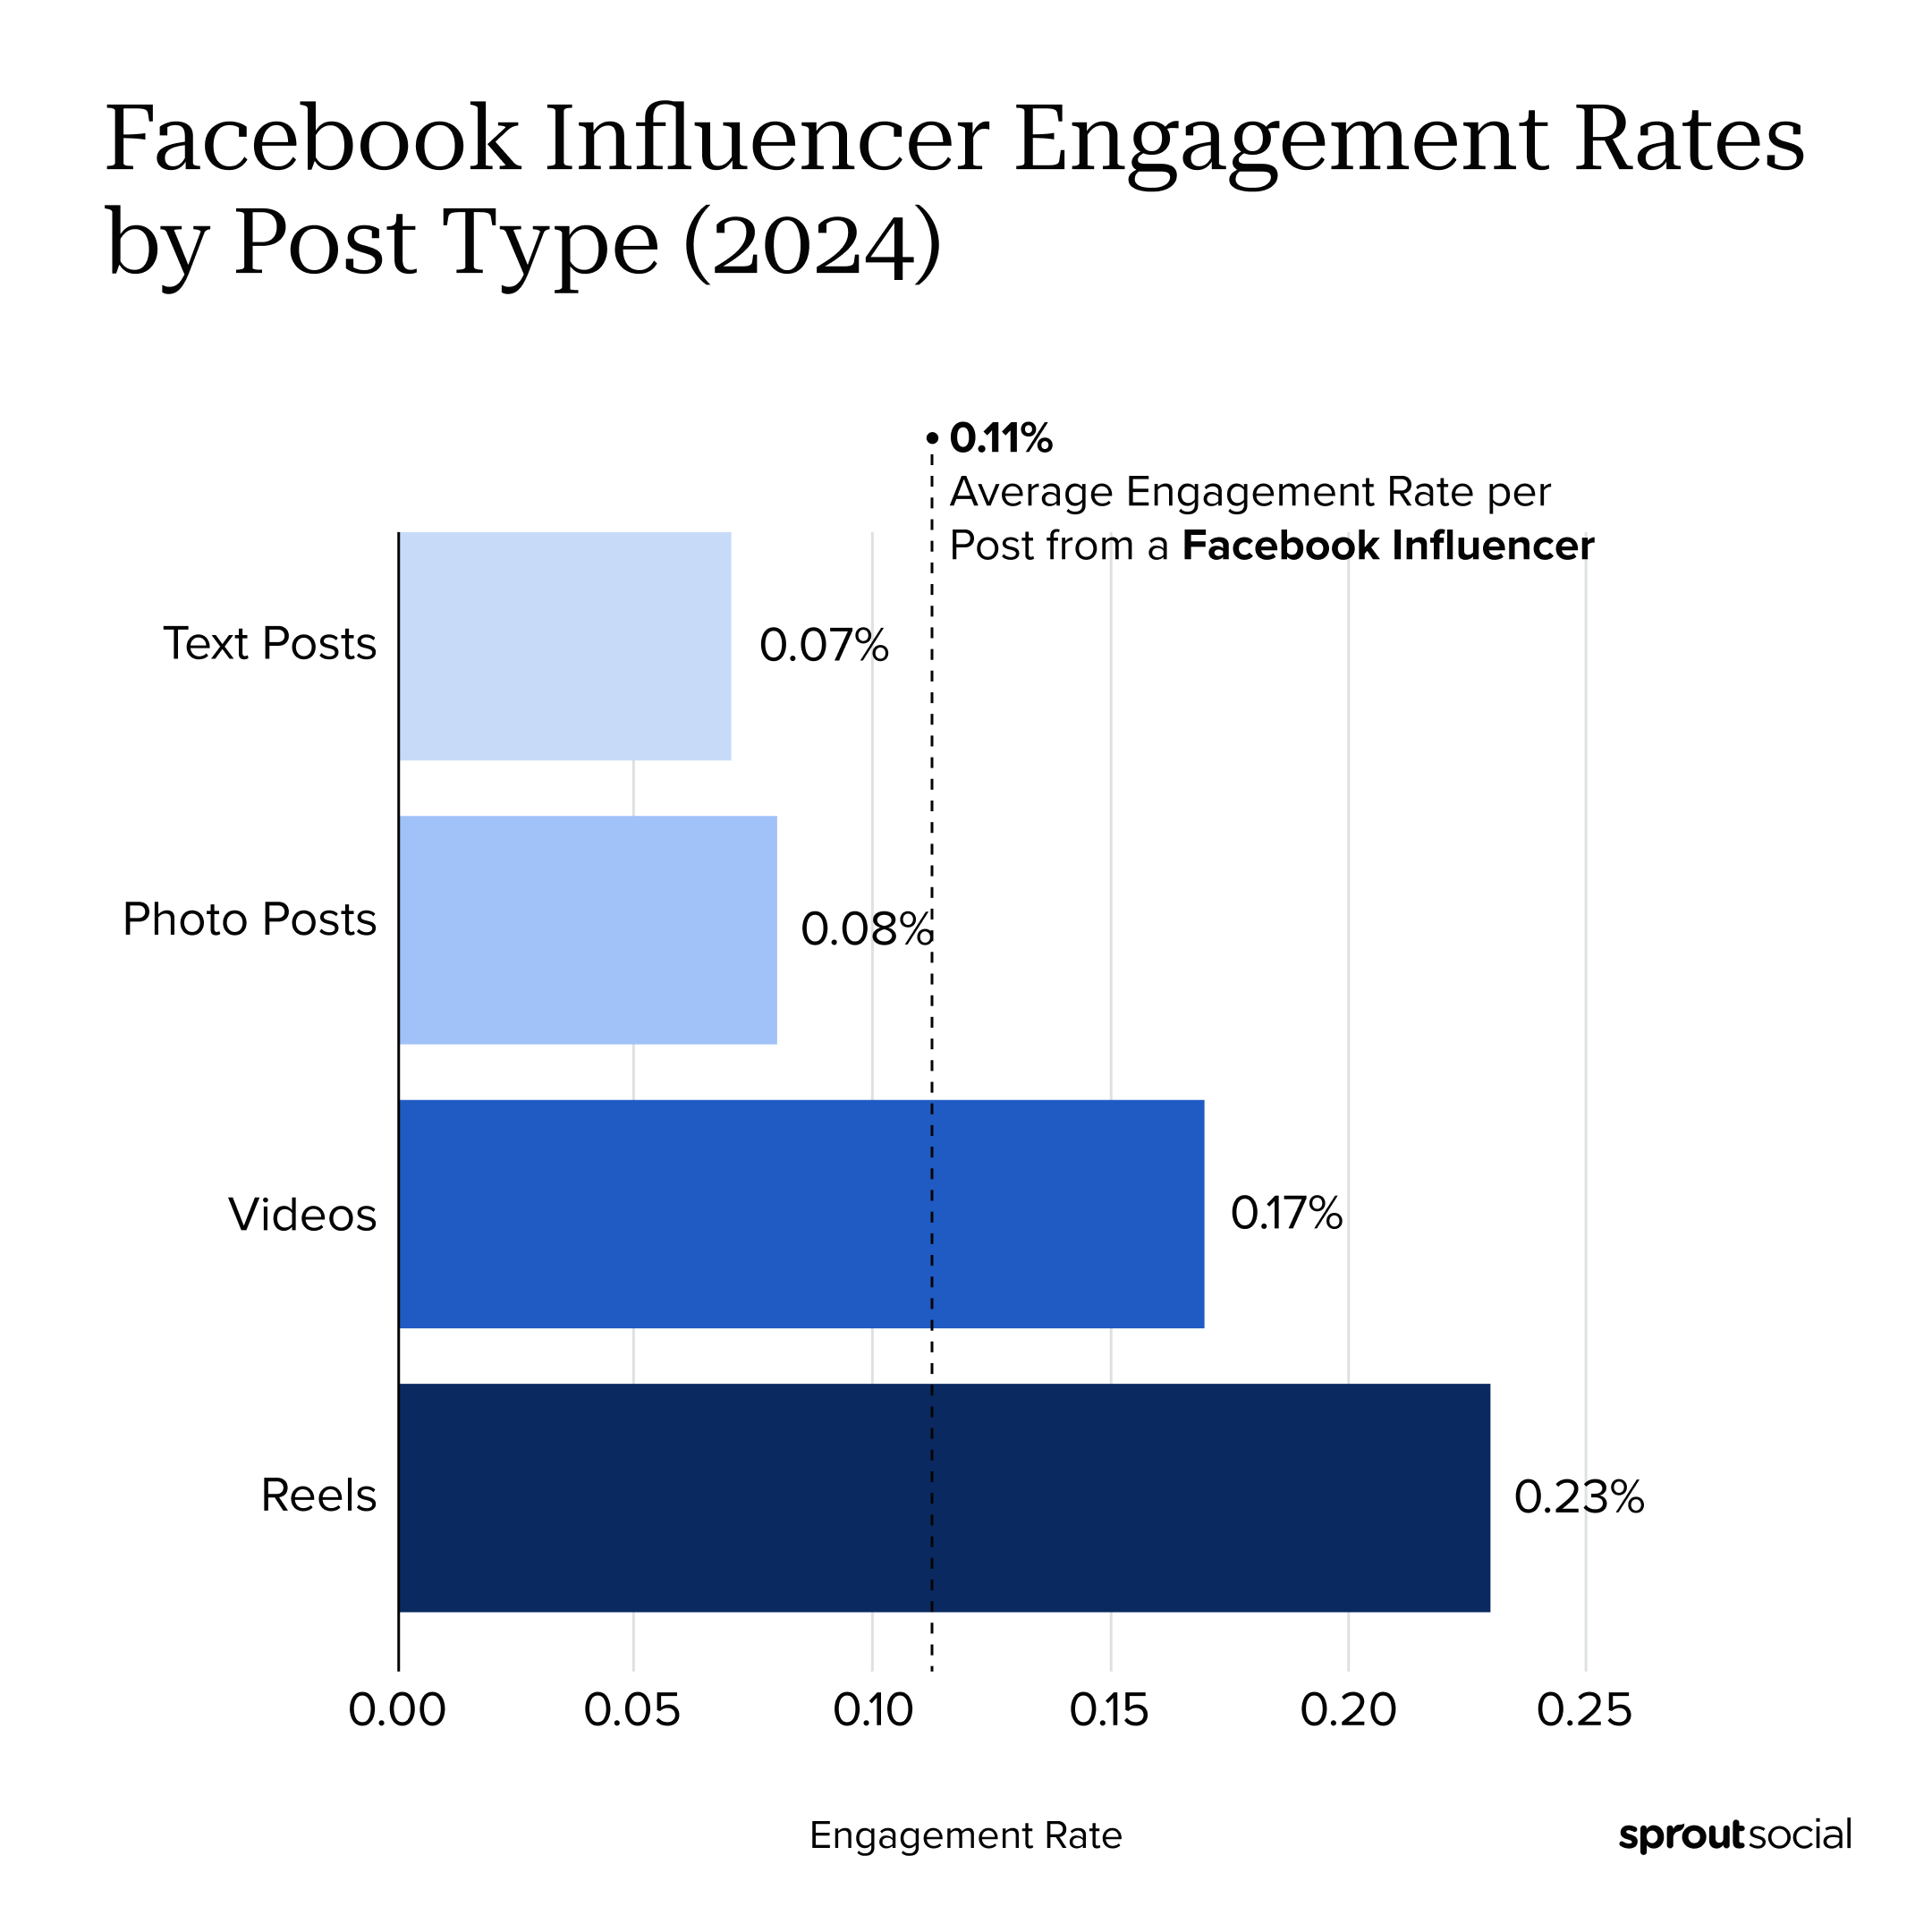
This trend highlights the growing effectiveness of short-form content (Reels) for Facebook influencer marketing. To maximize engagement as part of your influencer marketing initiatives on this platform, focus on more engaging and dynamic video partnerships. Additionally, ensuring your content is pertinent to your target audience can significantly enhance the impact of your influencer marketing endeavors on Facebook.
29. Nano- and micro-influencers on Facebook deliver strong ROI
Grasping pricing expectations is crucial for budgeting influencer marketing campaigns. Here’s a breakdown of the average cost per post based on Facebook influencer tiers from 2024:
- Nano-influencers (1K–10K followers): $137.50
- Micro-influencers (10K–50K followers): $750
- Mid-tier influencers (50K–500K followers): $6,875
- Macro-influencers (500K–1M followers): $18,750
- Mega-influencers (1M+ followers): $137,500
- Celebrities: $275,000
Compared to TikTok and Instagram, top-tier influencers on Facebook command higher fees. However, if you’re aiming to stretch your budget, engaging nano- and micro-influencers on Facebook can provide a cost-effective way to initiate influencer campaigns on this social network. These influencers not only come at a lower cost per post but also boast highly engaged niche audiences and more authentic relationships than higher-profile creators.
30. Facebook influencer posts generated $63.1 billion in Earned Media Value in 2024
In 2024, total Earned Media Value (EMV) from Facebook influencer contributions was appraised at $63.1 billion, according to Sprout’s Influencer Marketing insights.
With $63.1 billion in EMV realized through Facebook in 2024, it’s clear that influencer content remains a formidable force for brand visibility. Despite lower engagement figures on the platform, the influence remains potent.
31. The U.S., India, and Latin America display the highest Facebook influencer engagement
Global reach is a significant perk of Facebook; however, levels of engagement differ by region. Our Sprout Influencer Marketing findings indicate the top five nations with the highest engagement from Facebook influencer posts in 2024:
- United States: 4.84 billion engagements
- India: 1.43 billion engagements
- Mexico: 1.41 billion engagements
- Brazil: 1.1 billion engagements
- Italy: 1.05 billion engagements
The U.S. leads significantly, but Mexico and Brazil also exhibit notable engagement levels. Users in these regions engage intensely with influencer content, suggesting localized partnerships can enhance brand affinity and boost conversion prospects.
How Do These Facebook Statistics Shape Your Social Media Strategy?
These Facebook statistics demonstrate that the platform thrives for both marketers and consumers. We trust you now have deeper insights into the types of content, advertisements, and messaging that will resonate with your brand and target demographic. To elevate your effectiveness in engagement and efficiency, explore these Facebook marketing tools designed to assist you!
The article 31 Facebook statistics marketers should consider for 2025 was originally published on Sprout Social.

Recent Comments