
Honestly, how frequently do you review the analytics for your Instagram Stories?
Tracking interactions with Stories is essential for business accounts.
Companies depend on Stories to remain prominent in their followers’ feeds. Stories are also one of the most popular and highly engaged features on Instagram.
Stories are a treasure trove of marketing information, from the types of content to the messaging and beyond.
That said, it’s easy to overlook siloed Story data among the rest of your Instagram analytics.
We will provide guidance on how to review analytics for your Instagram Story and uncover valuable information.
What are Instagram Story analytics?
Instagram Story analytics represent the measurement of your IG Stories performance.
The metrics you can track via Instagram analytics are broken down into three types:
- Metrics that evaluate engagement, such as likes, shares, and responses.
- Reach metrics that measure the total impressions and accounts reached by your Stories
- Navigation metrics that track actions taken by Story viewers (ex: taps back, DMs and more)
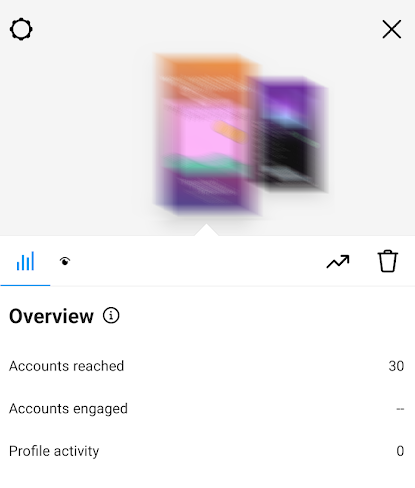 The information provided above indicates how effectively you are connecting with your audience. Additionally, the data reveals potential new ways to engage with them.
How to see your Instagram Story analytics
Chances are you already check your real-time analytics when your Stories are live.
Your performance data remains even after your Stories disappear after 24 hours.
If you’re only tracking single Stories as they happen, you’re missing out on bigger trends and insights. The good news? IG now aggregates your Stories data for up to two years.
More good news: there are multiple ways to view your Instagram Story analytics ASAP. This includes Instagram’s native Insights and reporting with tools like Sprout Social.
Note: you need either a business or creator account to access your Stories data.
How to view Instagram Story analytics using Instagram Insights
If you have the correct account type, here is an overview of the steps required.
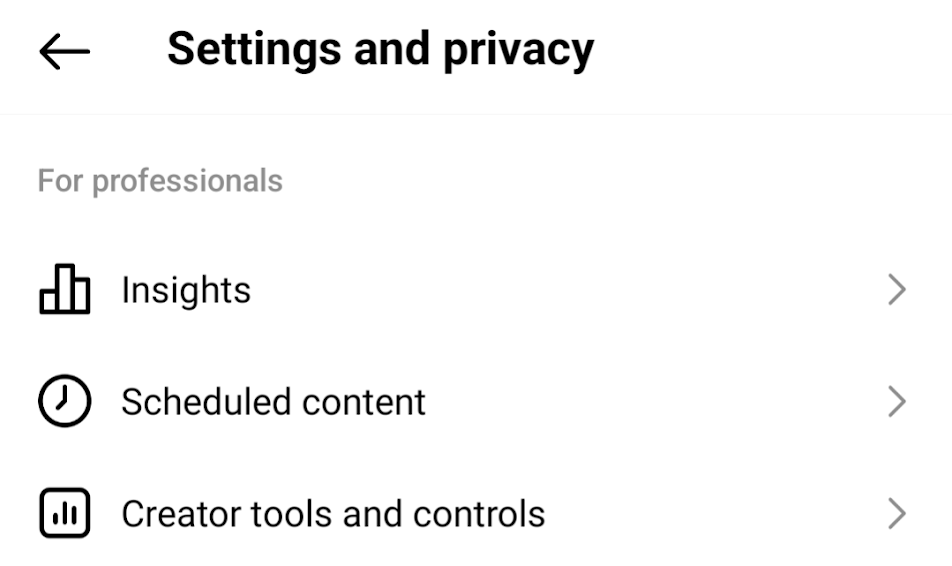
Step 1. Tap the (☰) menu from your profile to access “Settings and privacy.”

Step 2. Scroll and select “Insights” (found under “For professionals” in a creator account).
Step 3. At the Insights menu, scroll down and select the “Content You Shared” menu. Tap “Stories” when prompted to select a content type.
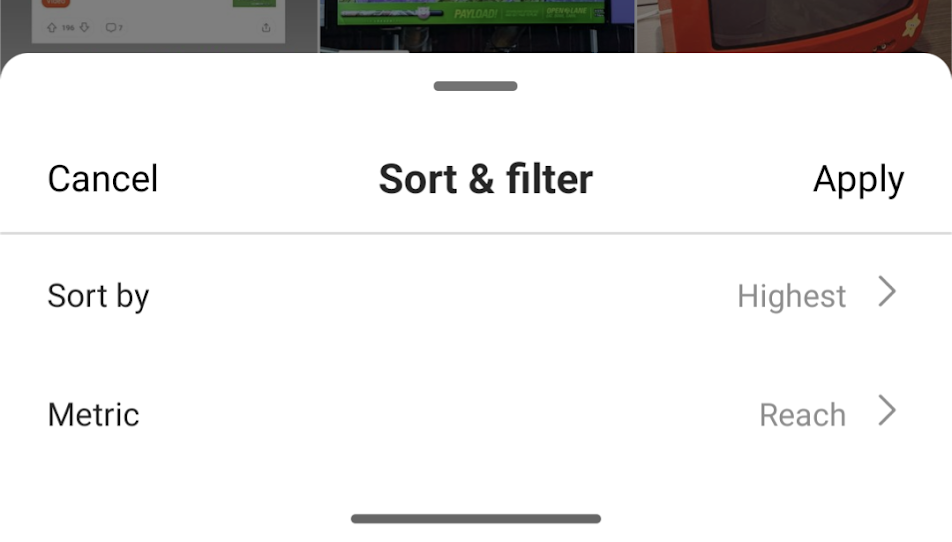
 Step 4. From here, you can scroll through your most recent Stories (or filter content based on metrics such as reach or impressions).
Step 5. Tap a specific Story for a detailed breakdown of its analytics and performance data.
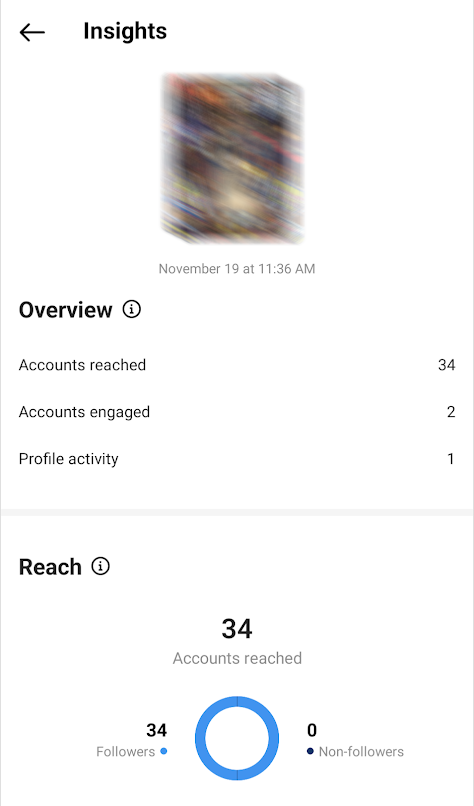
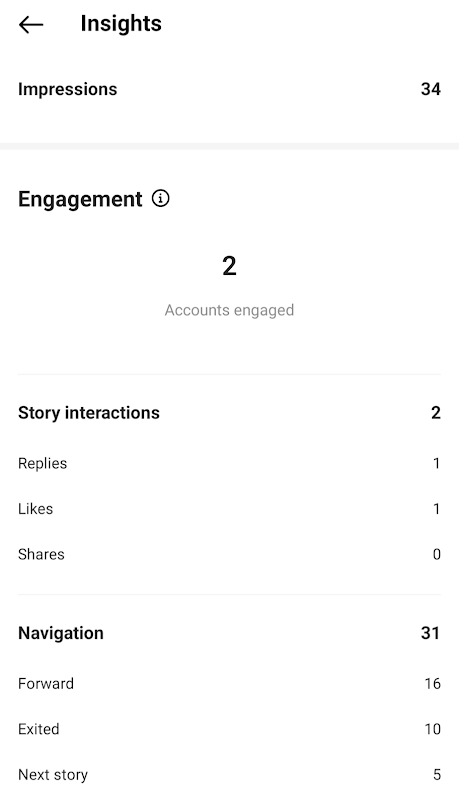
And you’re good to go!
You have the option to monitor your Instagram Stories analytics through Story Highlights. Just navigate to your highlights and select “Activity” on the Story you wish to analyze. You will have access to most of the same metrics mentioned earlier. Although you cannot view the viewers of your Stories, you can see who has “Liked” them.
How to see your Instagram Story analytics using Sprout Social
Sprout Social’s suite of Instagram analytics tools makes it easy to uncover your Story data. The bonus of using Sprout is the ability to track performance alongside all of your brand’s content.
Here is the method for analyzing your Stories using Sprout’s report for Instagram Business Profiles:
Step 1. Once you’re logged into your Sprout Dashboard, go to “Overview.”
Step 2. Select a business profile or account to analyze using the “Filter” option.
Step 3. Select “Performance Summary.”
Step 4: Choose the option labeled “Stories performance.”
Step 5. Select a date range for your Stories. You’ll then see a breakdown of various reports and performance metrics.
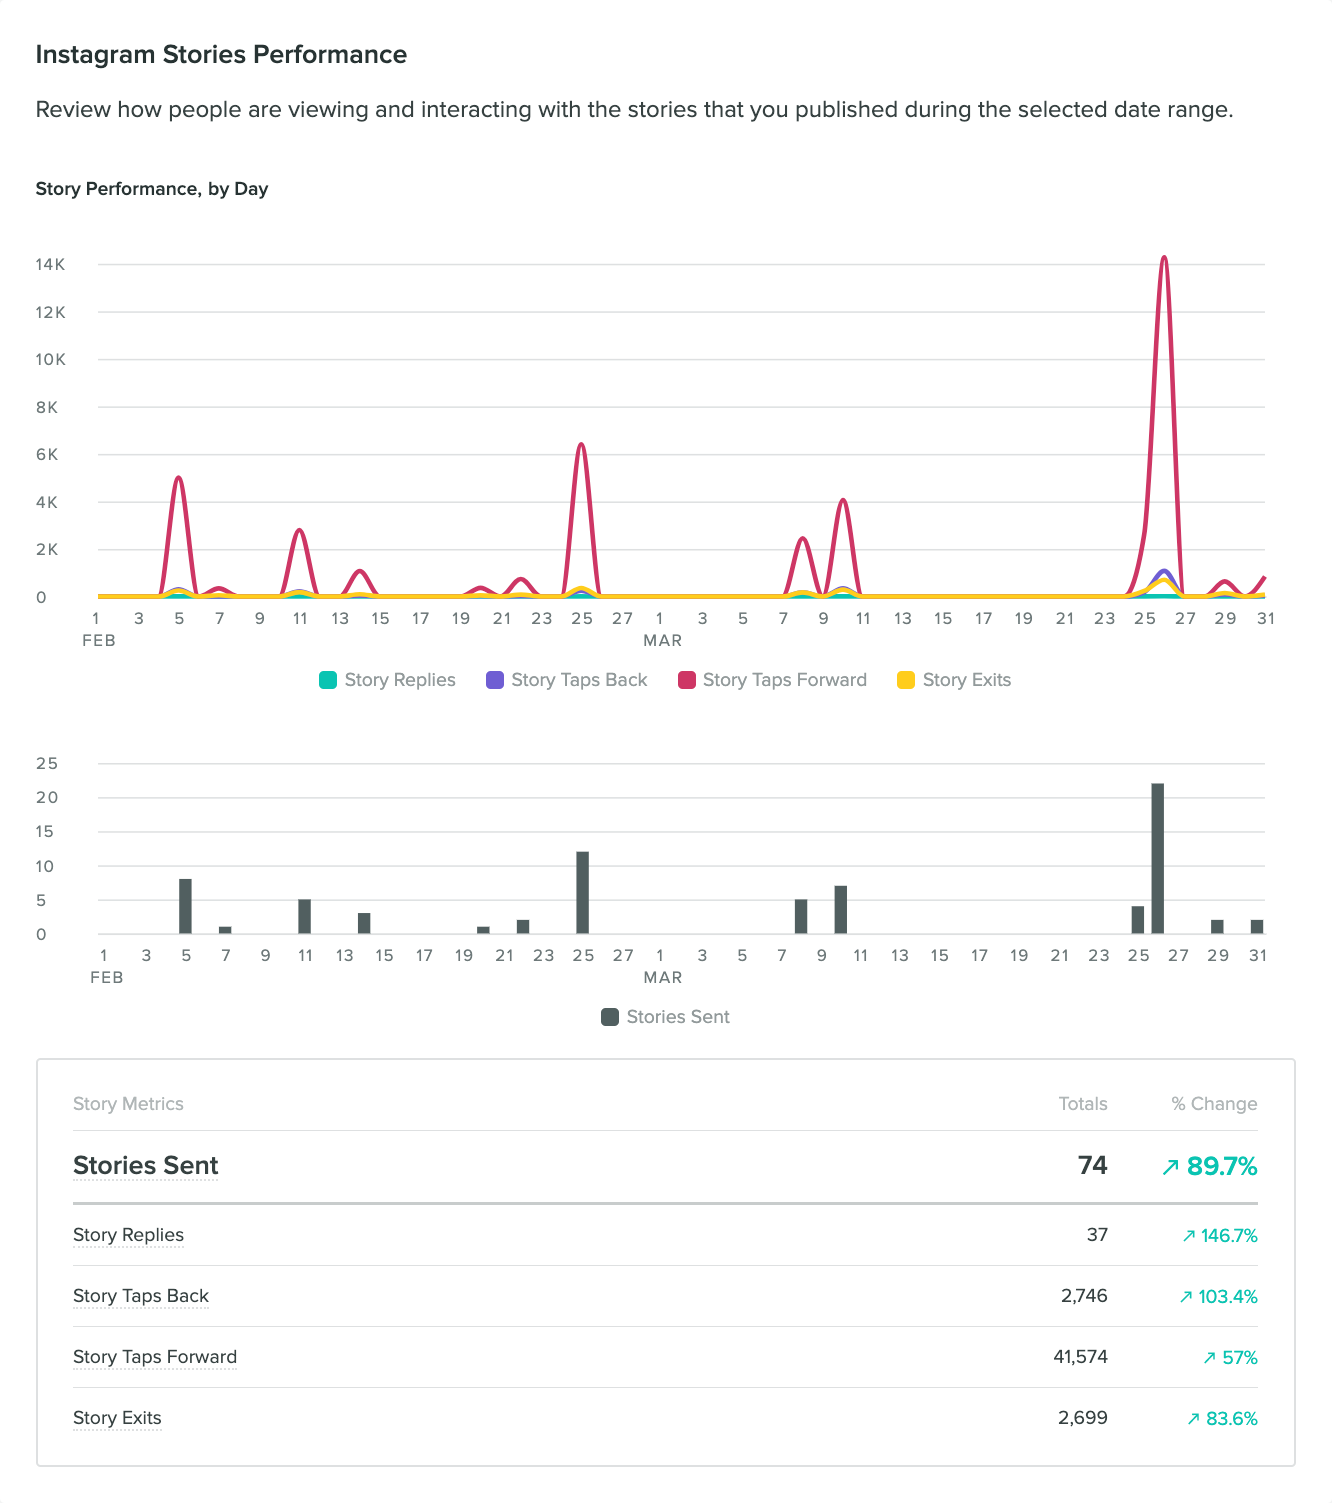
Now, let’s look at the process when using the Post Performance report in Sprout Social. Assuming you’re logged in, here’s all you need to do:
Step 1. Select the Instagram profile(s) you want to view Story analytics for.
Step 2. When prompted to choose between Post Types, select “Story.”
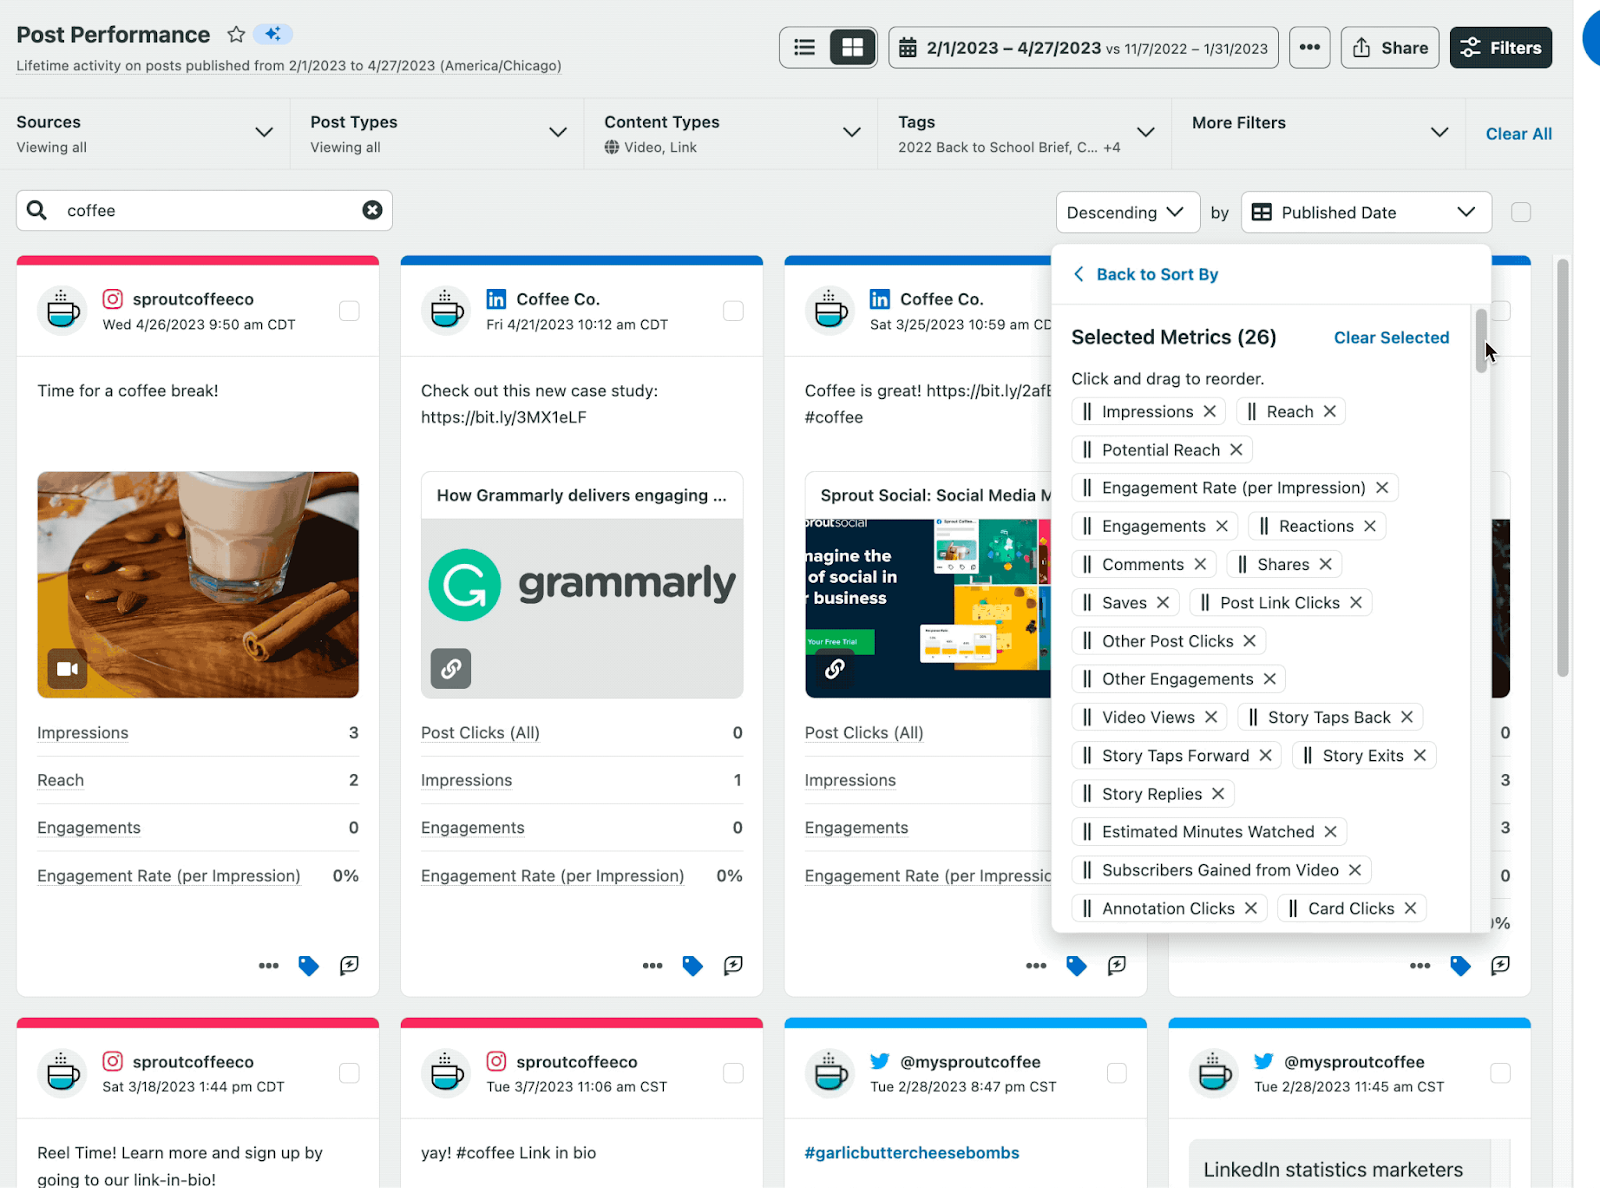
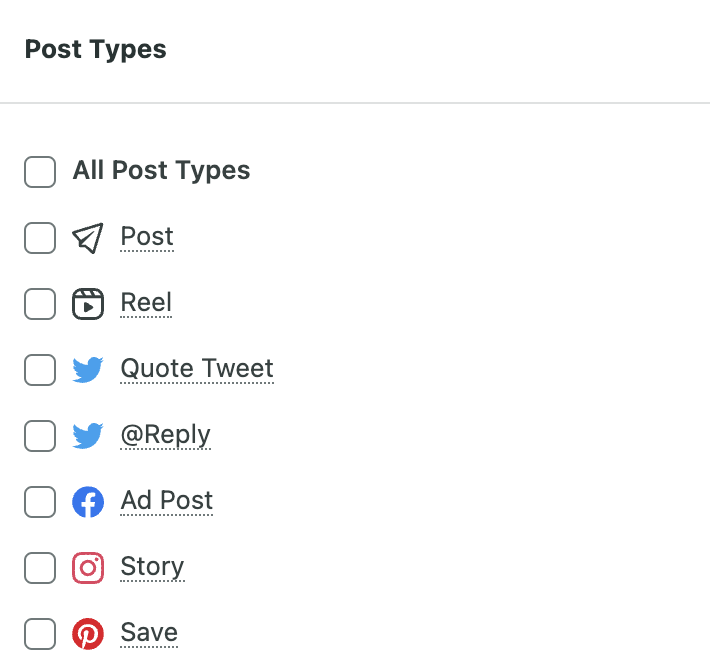 Step 3. The report will aggregate your Stories. You can use the list view to sort your Stories based on date and/or performance. You can also export your data from here.Easy enough, right?
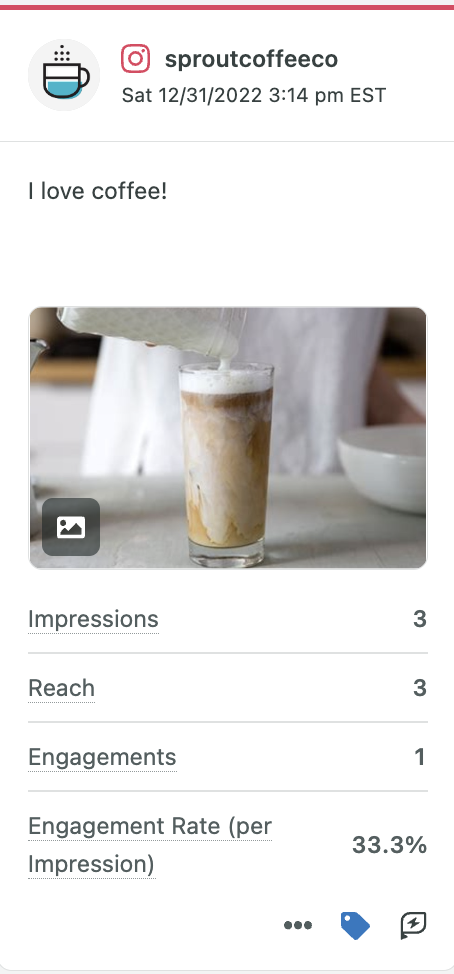
Six important metrics for Instagram Stories that you need to monitor.
Keeping an eye on your Instagram metrics goes hand in hand with growing your account.
Because data can clue you in on what’s working and what’s not when it comes to engagement.
But again, tracking Story metrics can be tricky because they’re kind of siloed on their own.
This indicates the importance of utilizing a platform such as Sprout Social. The platform effortlessly sorts out particular Story metrics and provides comprehensive analyses for them. This allows you to concentrate on your key metrics and eliminates the need to sift through IG Insights.
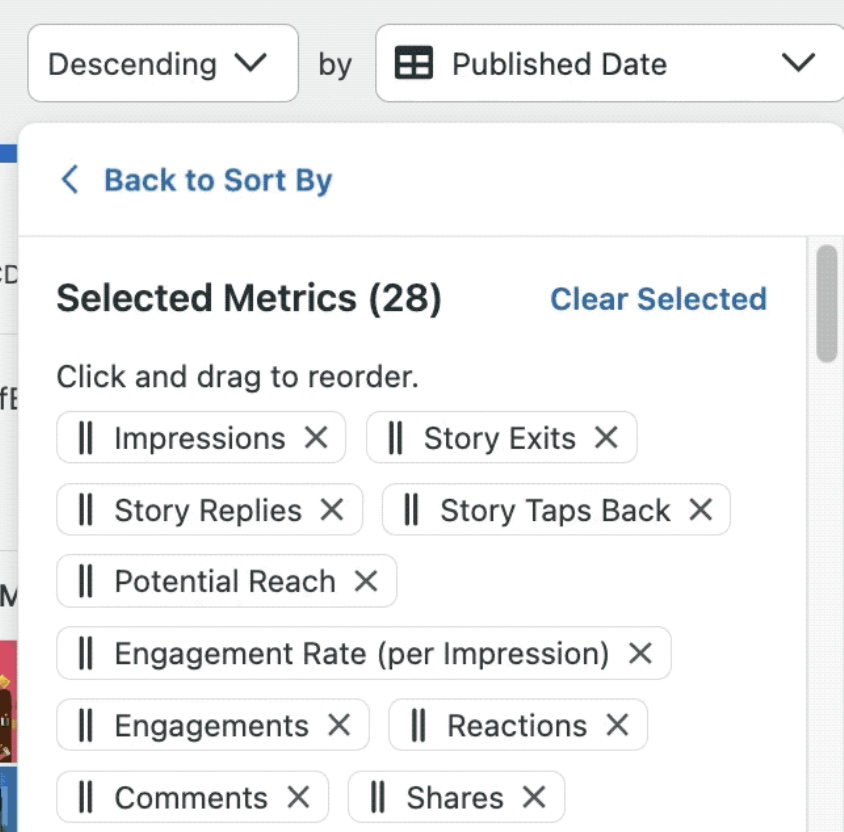
But what metrics should you be tracking when checking your Instagram Story analytics? Sure, interactions and engagements are obviously crucial. They aren’t the only ones, though.
Below are some additional data points to consider that often get swept under the rug.
Story Replies
Story replies are the number of Instagram DMs you received on your Story during its lifetime.
Getting unprompted (positive!) replies from your Stories means you’re nailing your content. More interactions and engagement signal strong relationships and loyalty with your audience.
If you’re lacking in Story Replies, you may want to consider a more direct response to your posts. Not to mention inserting more calls-to-action (but more on that later).
Story Taps Back
Story Taps Back are the number of times people tapped to return to your previous Story.
These are interesting because they offer insight into Stories beyond the post you’re tracking.. For example, taps back can highlight how a previous post in a series of Stories was notable. This doesn’t necessarily mean the post you’re looking at was “bad” or “boring,” though.
This highlights the importance of looking at your Instagram Stories analytics holistically. Context matters, especially when publishing multiple Story posts side-by-side.
Story Taps Forward
The metric “Story Taps Forward” represents the frequency with which viewers tapped on your existing Story to proceed to the subsequent one.
You can think of taps forward as a sort of bounce rate or retention metric. If you post a series of Stories and someone sticks around for all of them, that’s typically a good sign.
On that note, taps forward can also highlight how long your brand’s series of Stories should be. Maybe you retain most viewers with five Stories but see a big drop-off beyond that. If so, you should keep that in mind next time you make a series of posts.
Consider also that taps can also happen out of impatience. You have to read between the lines here since you can’t monitor the amount of time spent on your Stories. Again, context matters.
Story Exits
Story Exits are the number of times people swiped to stop viewing your Story during its lifetime.
Pay close attention to exits, especially when experimenting with new types of Stories. For example, you might see a spike in exits during video Stories or after posting a long series.
If so, take note and keep that in mind for your upcoming content strategy. While Story Exits don’t necessarily mean any given Story was “bad,” they can signal the following:
- The length of your Story series was excessive (consider that viewing more than 10 slides may discourage users)
- Your content was repetitive or redundant
- Your audience wasn’t interested in your Story
Story Impressions
Story Impressions are the number of times your story was displayed to users during its lifetime.
The greater the number of viewers for your Stories, the more beneficial it is! Gaining views from people other than your followers is also a good indication for your Stories. Pay attention to the Stories that receive the most views.
Average Reach Per Story
Average Reach Per Story is the average number of unique users who viewed your story during its lifetime.
Ideally, the average number of people who see your Stories should increase as your account grows. This emphasizes the significance of regularly tracking your Instagram analytics. If you don’t, you won’t be able to tell if your posts are making an impact.
Speaking of, Sprout makes it a cinch to consolidate all of these metrics (and more). Seeing your Stories data alongside the rest of your IG performance offers a holistic understanding of what’s working and what’s not.
Tips for optimizing your strategy using Instagram Story analytics
It’s clear that monitoring your Instagram Story metrics is crucial, but how about making sure those figures are improving?
To wrap things up, let’s dig into how to optimize your Instagram marketing and earn engagement with Stories.
Take advantage of interactive Instagram Story features
Don’t’ sleep on all of the Instagram features built specifically to engage your Story viewers.
Stickers act as an organic method to gain engagement and function as inventive prompts for action. Although stickers are not necessary for every Story, consider how to incorporate interactive components such as:
- Polls
- Quizzes
- Sliders
- Countdowns
- Emoji reactions
- Links

Stickers can help you come across as engaging with your audience versus talking at them. Not to mention they help inject a sense of personality into your calls-to-action.

Feature UGC and tag other accounts in your Stories
Doing anything that pleases the IG algorithm is beneficial. This includes encouraging tags, shares, and engagement with your followers and clients.
Note that many retail brands use Stories as a place to highlight UGC beyond their feeds.

This is a low-hanging way to get additional shares and more eyes on your content as creators repost your content. This can be done for organic UGC and content from influencers alike.
As time goes on, you can evaluate which kinds of user-generated content Stories receive the highest levels of engagement. This allows you to enhance your content strategy even more.
Share your Stories at the best times for engagement
We’ll bite: Stories are tricky when it comes to picking best times to post. Unlike Reels or Carousel posts, it’s pretty standard for brands to publish multiple Stories throughout the day.
That said, you can still try to stick to times where Instagram users are typically most engaged.
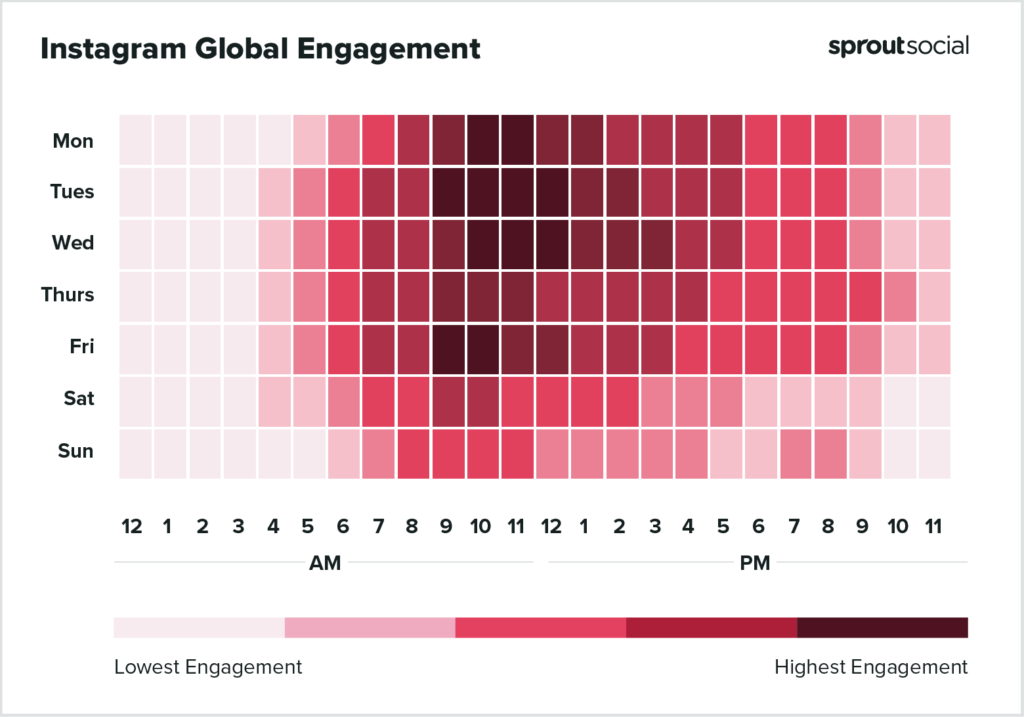
Choosing the optimal time for your brand’s activities relies on several factors. Take into account:
- A consistent cadence of Stories means you’ll stay visible in your followers’ feeds. Try spreading your Story posts throughout the day versus dumping them all at once.
- On the flip side, you may find that a rapid-fire cadence works best for your audience. This speaks to the importance of checking your Instagram Story analytics. Don’t assume!
- By using Sprout to schedule your Stories, you can achieve your target posting frequency without having to post in the moment.
Many brands will publish a series of three-to-five Stories side-by-side for promotions. This is in addition to consistently republishing their Reels or Carousels to their Stories. Finding a publishing frequency that makes sense for your brand requires some trial-and-error.

Use Instagram audience insights to guide your content formats
Not to sound like a broken record but every brand’s Instagram target audience is different.
Some audiences prefer videos while others skip them. You might find that your followers love polls and going back-and-forth with you. Maybe you actually find you earn more Stories engagement when you post less.
Regardless, you need to keep a constant pulse on your Instagram analytics to make informed decisions. With a tool like Sprout, you can pick your prioritize metrics across IG and track them with ease.

What can you learn from your Instagram Story analytics?
It is essential for brands to monitor their metrics on Instagram due to the platform’s increasing competitiveness.
But Stories require special attention.
The fact that you can publish them so often versus other post types is a gift for marketers. Stories offer a way to consistently learn from your audience and figure out what makes them tick.
Nonetheless, to fully utilize the data, uniformity and context are essential. This is precisely the role Sprout Social plays, providing a central location for monitoring all of your brand’s Instagram analytics.
If you haven’t already, check out Sprout’s Instagram analytics features to see what insights your brand can learn to grow engagement faster.
The post Instagram Story analytics: how to track the right metrics for your brand appeared first on Sprout Social.
Instagram Stories are a great way for brands to engage with their followers and create content that stands out. However, without understanding how to measure the performance of your brand’s content, it can be difficult to know if your efforts are paying off. Fortunately, Instagram Story analytics can provide valuable insights into how your content is performing.
One of the most important metrics to consider when evaluating your Instagram Story analytics is reach. Reach measures the number of unique users who have seen your story. This metric can help you understand how many people are being exposed to your content and if it’s reaching the right audience. Additionally, you can use reach to compare the performance of different stories and determine which ones are resonating with your followers.
Another key metric to consider is engagement. Engagement measures the number of interactions with your story, such as likes, comments, and shares. This metric can help you understand how engaged your followers are with your content and if they’re taking the desired action. Additionally, you can use engagement to compare the performance of different stories and determine which ones are resonating with your followers.
Finally, you should also consider the number of impressions your story receives. Impressions measure the total number of times your story has been viewed. This metric can help you understand how many people have seen your content and if it’s reaching the right audience. Additionally, you can use impressions to compare the performance of different stories and determine which ones are resonating with your followers.
By understanding these key metrics, you can gain valuable insights into how your brand’s content is performing on Instagram Stories. This information can help you make informed decisions about how to optimize your content for maximum engagement and reach. With the right analytics in place, you can ensure that your brand’s content is reaching the right audience and resonating with them in the most effective way possible.
Source: sproutsocial.com

Recent Comments