
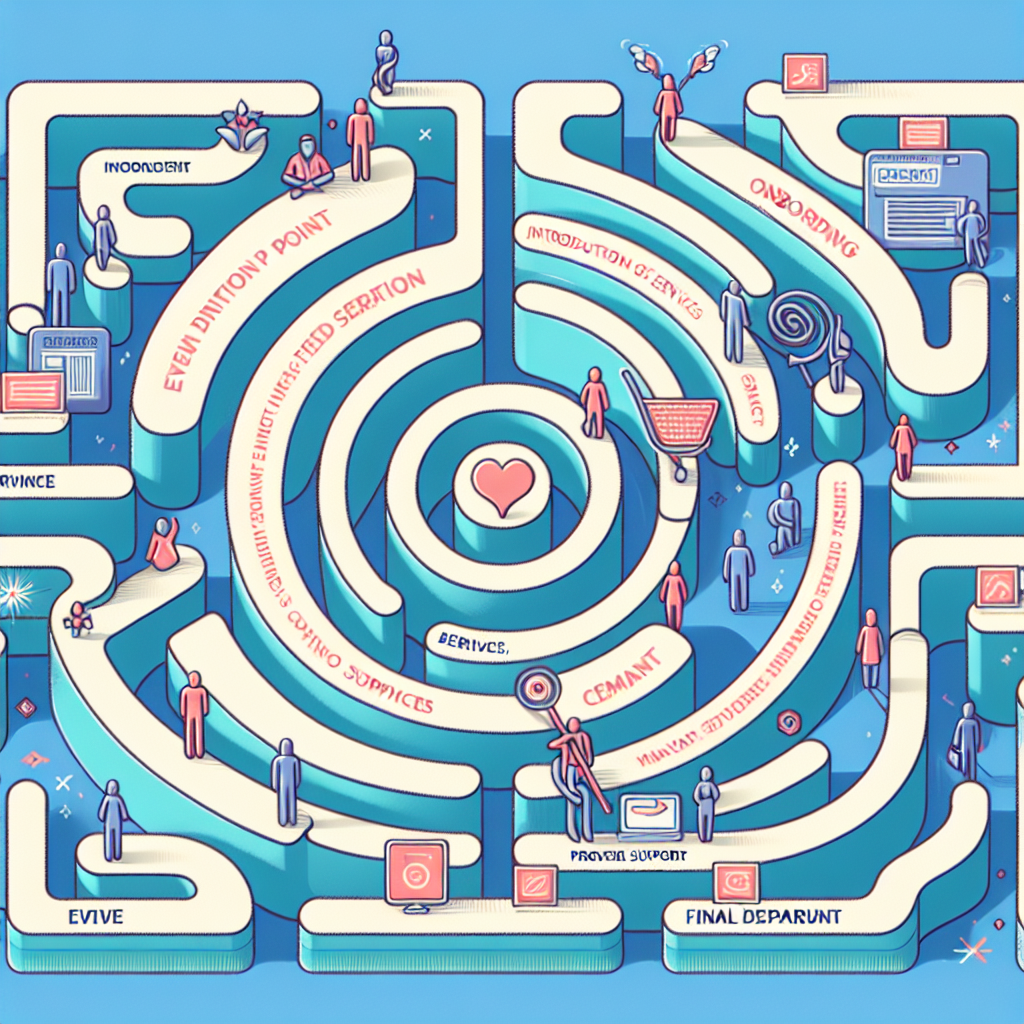

Modern customer journeys are no longer linear or predictable. They are shaped by dynamic entry and exit points triggered by a web of events and interactions.
Understanding these moments is critical for businesses aiming to deliver personalized experiences, foster loyalty, and stay competitive. Here’s how event-based journey analytics can redefine how companies map, measure, and optimize customer interactions.
Dynamic entry and exit points: A shift in journey mapping
Working with various organizations, I’ve found many challenged by the gap between customer expectations and the touchpoints they encounter. Many businesses still rely on outdated metrics that fail to capture the complexity of modern customer interactions. As a result, they have a fragmented understanding of the customer journey. This leads to missed opportunities for meaningful engagement.
A key aspect often overlooked is the dynamic nature of customer entry and exit points. Today, customers are not bound by traditional pathways. They enter and exit journeys based on various events, influenced by internal motivations and external triggers. Recognizing these changing entry and exit points requires shifting from static journey mapping to a more dynamic, event-driven approach.
Dig deeper: Customer journey maps: What you need to know
Building capability at AWS Pinpoint: A personal experience
Building this capability at AWS Pinpoint was a complex endeavor. A user may associate with many endpoints, channels, or devices. Providing analytics at a per-user level required us to associate all their devices and endpoints with the same identity.
This complexity is addressed in the AWS Pinpoint blog, which explains:
“Journey-level execution metrics include information about the endpoints that entered (or were prevented from entering) your journey. These metrics are divided into several sections, which are discussed in detail in the following sections.
- Entry metrics: The first section in the list of journey execution metrics shows how many participants entered your journey. This section contains the following information:
- Currently in journey: The number of participants who are actively proceeding through the activities in the journey.
- Completed journey: The number of participants who have reached an end activity in the journey.
- Lifetime journey entries: The number of participants who have entered the journey since the start date of the journey. This section also contains a chart that shows the percentage of participants who completed the journey and the percentage of participants who are still in the journey.”
This let us provide a comprehensive view of customer engagement, ensuring that all interactions were accurately captured and analyzed.
Real-world challenges: Integrating data and ensuring trust
The integration of disparate data sources to create a cohesive view of the customer journey is another common challenge. It requires advanced technology and a cultural shift within organizations to break down silos and foster cross-departmental collaboration. Successful companies often implement cross-functional teams dedicated to customer experience, ensuring that insights are shared and acted upon across the organization.
Another critical issue is the ethical handling of data, especially with stringent regulations like GDPR and CCPA. Businesses must prioritize transparency in data collection practices to maintain customer trust. This is not merely a compliance issue but a fundamental component of building long-term relationships with customers.
Dig deeper: How advanced customer journey analytics is shaping the future of engagement
Innovative approaches: Using AI and emerging technologies
A major challenge I’ve observed is integrating different data sources to create a unified view of the customer journey. This requires both advanced technology and a cultural shift within organizations.
Companies need to break down silos and encourage collaboration across departments. Successful businesses often establish cross-functional teams focused on customer experience, ensuring insights are shared and acted upon.
Another key issue is the ethical handling of data, especially with strict regulations like GDPR and CCPA. Companies must be transparent in their data collection practices to build and maintain customer trust. This goes beyond compliance; it is essential for building long-term relationships with customers.
Challenging conventional wisdom: Quality over quantity
One common misconception is that more data always leads to better insights. In reality, the quality and relevance of data are much more important. Focus on capturing meaningful events that reflect customer intent and satisfaction rather than gathering large amounts of irrelevant data.
There is also a tendency to view customer journeys as linear processes. However, in today’s digital age, journeys are non-linear and highly personalized. Adopt a more flexible approach, recognizing that customers can enter and exit at multiple points, influenced by various factors.
Transforming customer data into actionable insights
Defining customer entry and exit points based on events is a powerful strategy. It helps businesses turn data into actionable insights, driving engagement and growth. By tackling challenges like data integration and privacy and using advanced technologies, you can create personalized experiences that connect with customers. Event-based journey analytics offers a clear path to success, building loyalty and ensuring long-term business growth.
Dig deeper: 3 ways to connect with consumers during today’s complex journeys
The post Understanding customer entry and exit in event-based journeys appeared first on MarTech.
# Analyzing Customer Onboarding and Departure in Event-Driven Journeys
In today’s fast-paced, customer-centric world, businesses are increasingly relying on event-driven architectures to deliver personalized and seamless experiences. Event-driven journeys are dynamic, real-time processes that respond to customer actions, behaviors, and preferences, enabling organizations to engage with their audience in meaningful ways. Two critical stages in these journeys are customer onboarding and departure. Understanding and analyzing these stages is essential for optimizing customer experiences, improving retention, and driving long-term business success.
This article delves into the intricacies of customer onboarding and departure in event-driven journeys, exploring their significance, challenges, and strategies for effective analysis.
—
## **Understanding Event-Driven Journeys**
Event-driven journeys are customer experiences shaped by specific events or triggers, such as signing up for a service, making a purchase, or canceling a subscription. These journeys are non-linear and adaptive, allowing businesses to respond to customer actions in real time. By leveraging event-driven architectures, organizations can create highly personalized interactions, automate workflows, and gain actionable insights into customer behavior.
The two critical touchpoints in any event-driven journey are:
1. **Customer Onboarding**: The initial phase where customers are introduced to a product or service.
2. **Customer Departure**: The point where customers disengage or leave the service, often referred to as churn.
Both stages are pivotal in shaping the overall customer experience and determining the success of the business.
—
## **Customer Onboarding in Event-Driven Journeys**
### **The Importance of Onboarding**
Customer onboarding is the first impression a business makes on its customers. A smooth and engaging onboarding process sets the tone for the entire customer relationship. It is during this phase that customers learn how to use a product or service, explore its value, and decide whether it meets their expectations.
### **Key Metrics to Analyze Onboarding**
To evaluate the effectiveness of the onboarding process, businesses can track the following metrics:
– **Time-to-Value (TTV)**: The time it takes for customers to realize the value of the product or service.
– **Onboarding Completion Rate**: The percentage of customers who successfully complete the onboarding process.
– **Engagement Metrics**: Actions taken during onboarding, such as account setup, feature exploration, or tutorial completion.
– **Drop-Off Points**: Stages where customers abandon the onboarding process.
### **Challenges in Onboarding**
Despite its importance, onboarding can be fraught with challenges, including:
– Lack of personalization in the onboarding flow.
– Overwhelming customers with too much information at once.
– Technical issues or friction in the user interface.
– Failure to communicate the product’s value proposition effectively.
### **Strategies for Optimizing Onboarding**
To improve onboarding in event-driven journeys, businesses can adopt the following strategies:
1. **Leverage Data-Driven Insights**: Use customer data to personalize the onboarding experience based on individual preferences and behaviors.
2. **Implement Progressive Disclosure**: Introduce features and information gradually to avoid overwhelming customers.
3. **Automate Triggers**: Use event-driven triggers to guide customers through the onboarding process, such as sending reminders or offering assistance when they encounter roadblocks.
4. **Monitor and Iterate**: Continuously analyze onboarding metrics and iterate on the process to address pain points.
—
## **Customer Departure in Event-Driven Journeys**
### **The Significance of Departure Analysis**
Customer departure, or churn, is a critical indicator of business health. Understanding why customers leave can help organizations identify weaknesses in their offerings and take corrective actions to improve retention. In event-driven journeys, departure events are often preceded by warning signals, such as reduced engagement or negative feedback.
### **Key Metrics to Analyze Departure**
To gain insights into customer departure, businesses can monitor the following metrics:
– **Churn Rate**: The percentage of customers who leave over a specific period.
– **Engagement Decline**: A drop in usage frequency, feature interaction, or purchase activity.
– **Customer Feedback**: Reasons for departure provided through surveys, reviews, or support tickets.
– **Lifetime Value (LTV)**: The total revenue generated by a customer before departure.
### **Challenges in Departure Analysis**
Analyzing customer departure can be complex due to:
– Difficulty in identifying early warning signs of churn.
– Limited visibility into the underlying reasons for departure.
– Inability to act on insights in real time to prevent churn.
### **Strategies for Reducing Churn**
To minimize customer departure in event-driven journeys, businesses can:
1. **Identify Early Warning Signals**: Use predictive analytics to detect patterns that indicate potential churn, such as declining engagement or unresolved support issues.
2. **Proactive Retention Efforts**: Deploy event-driven triggers to re-engage at-risk customers, such as offering discounts, sending personalized messages, or providing additional support.
3. **Exit Surveys and Feedback Loops**: Collect feedback from

Recent Comments